Currency pair EUR/USD
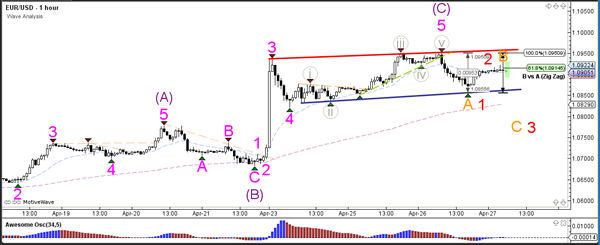
The EUR/USD is in a channel (red/blue lines) which is struggling to break above the 61.8% Fibonacci retracement level of wave 2 (green) near the round level of 1.10. A breakout above or below a trend line could indicate the next direction. A bullish break indicates a continuation within wave C (purple) whereas a bearish break indicates a potential reversal.
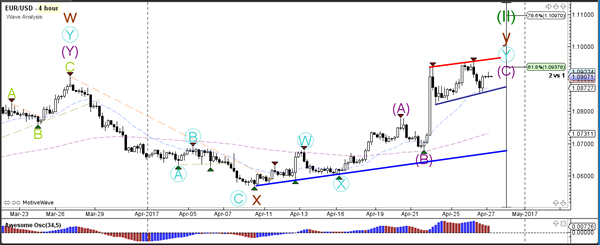
The EUR/USD could have completed waves 5 (grey/pink) within wave C (purple) if price manages to break below the support trend line (blue). If that occurs, price could be building either an ABC (orange) or 12345 (red).
Currency pair GBP/USD
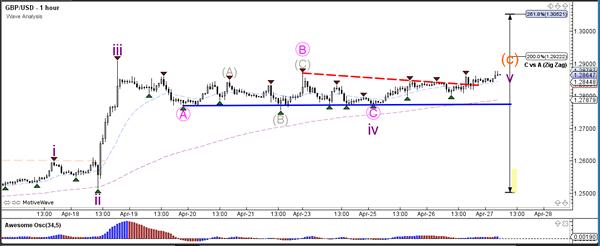
The GBP/USD broke the bull flag chart pattern (dotted orange) but the larger sideways zone (red/blue lines) remains intact. A potential bullish breakout could challenge 1.30.
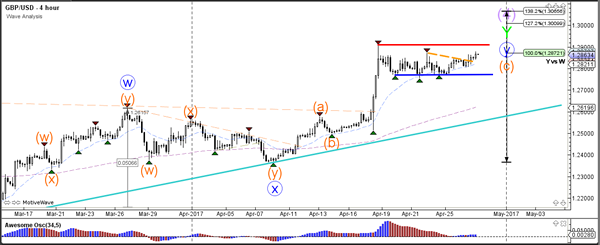
The GBP/USD seems to be in a wave 5 (purple) and its first target is 1.2925 at the 200% Fibonacci level.
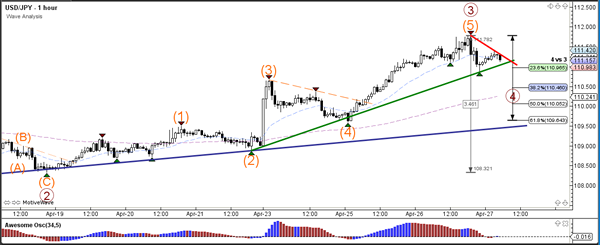
Currency pair USD/JPY
The USD/JPY could have completed wave 3 (brown) due to the bearish engulfing twins, which is the candlestick pattern that emerged near the 112 resistance. Price could now be building a potential wave 4 (brown) retracement if price stops at one of the shallow Fibonacci levels (23.6-50%).
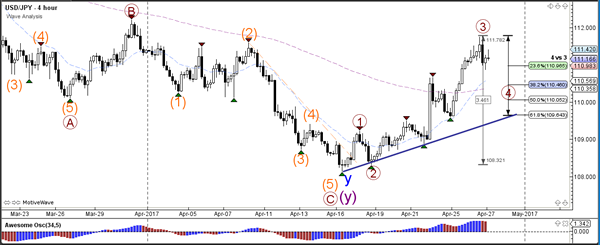
The USD/JPY has already made a retracement to and bounce at the 23.6% Fibonacci retracement level of wave 4 (brown). A break below the support trend line (green) could see a larger retracement unfold.