
A note on lower timeframe confirming price action…
Waiting for lower timeframe confirmation is our main tool to confirm strength within higher timeframe zones, and has really been the key to our trading success. It takes a little time to understand the subtle nuances, however, as each trade is never the same, but once you master the rhythm so to speak, you will be saved from countless unnecessary losing trades. The following is a list of what we look for:
- A break/retest of supply or demand dependent on which way you’re trading.
- A trendline break/retest.
- Buying/selling tails … essentially we look for a cluster of very obvious spikes off of lower timeframe support and resistance levels within the higher timeframe zone.
- Candlestick patterns. We tend to only stick with pin bars and engulfing bars as these have proven to be the most effective.
EUR/USD
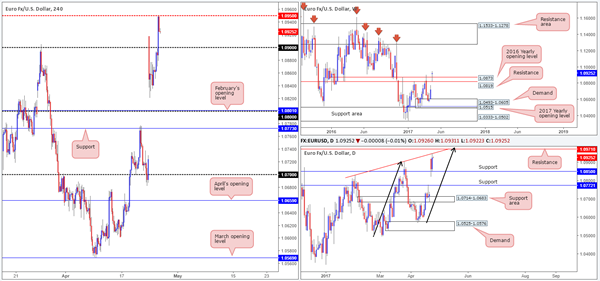
Going into the early hours of yesterday’s US segment, H4 price cleared the 1.09 handle on lower-than-expected US consumer confidence and ended the day touching gloves with mid-level resistance at 1.0950. While the bulls certainly appear in fine form this morning, traders may want to take into account that not only is 1.0950 now in play, but twenty or so pips above here there’s a daily resistance sitting at 1.0971 (converges with a trendline resistance taken from the high 1.0828 and an AB=CD completion point at 1.0980 [black arrows]). What is strongly favoring the bulls at the moment, however, is weekly price. Notice how the week’s open forced the unit above resistance at 1.0819 and the 2016 yearly opening level at 1.0873, which are both currently being used as support.
Our suggestions: Based on the above structure, we see three possible trade scenarios:
Look to buy the couple on any retest seen at 1.09. There’s not much H4 confluence seen here though, so waiting for additional confirmation is advised (a reasonably sized H4 bull candle should suffice – preferably a full-bodied candle).
Wait and see if the daily bulls can close price above the current daily resistance. Should this come to fruition, one could then look to trade any retest seen thereafter.
Go against the grain and consider shorting from 1.0971, given the daily confluence seen at the daily resistance level. To be on the safe side, we would personally wait for a H4 bear candle (preferably a full-bodied close) to form before committing, since ending up on the wrong side of weekly flow would not be pleasant.
Data points to consider: No high-impacting economic events.
Levels to watch/live orders:
- Buys: 1.09 region ([waiting for a reasonably sized H4 bull candle to form before pulling the trigger is advised] stop loss: ideally beyond the candle’s tail). Watch for a daily close to be seen above 1.0971.
- Sells: 1.0971 region ([waiting for a reasonably sized H4 bear candle to form before pulling the trigger is advised] stop loss: ideally beyond the candle’s wick).
GBP/USD
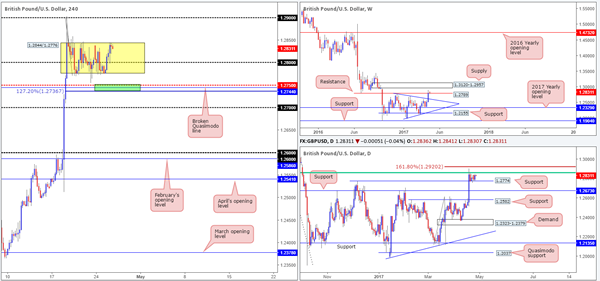
Since the 19th April, H4 price has been busy chiseling out a consolidation zone fixed between 1.2844/1.2776. Directly below this range sits 1.2750: an interesting level given that there’s also a AB=CD 127.2% Fib extension seen nearby at 1.2736 (drawn from the high 1.29) that unites closely with a broken Quasimodo line pegged at 1.2744 (green area).
Over on the weekly chart, we can see price trading marginally above resistance coming in at 1.2789, which could eventually encourage further buying up to supply at 1.3120-1.2957. Down on the daily chart, nevertheless, the candles are seen consolidating between support at 1.2774 and a H4 61.8% Fib resistance at 1.2859 (taken from the high at 1.3445).
Our suggestions: Technically speaking, we see two possible trade setups:
The H4 zone marked in green at 1.2736/1.2750 is, in our opinion, a nice area to consider an intraday bounce from. Apart from the H4 confluence, this zone is also seen planted directly beneath both the H4 range and the said daily support. For that reason, it could perhaps be a nice base to help facilitate a fakeout! The only grumble, of course, is that weekly sellers could still be active from resistance at 1.2789, hence the reason for not expecting much more than an intraday bounce from the H4 area.
A H4 close above the aforementioned H4 range could be considered an important cue for longs. A retest to the top side of this broken area as support followed by a reasonably sized H4 bull candle (preferably a full-bodied candle) would be sufficient enough to enter long, targeting 1.29, followed by 1.2920 (weekly 161.8% Fib ext. taken from the low 1.2108) and then the underside of weekly supply at 1.2957.
Data points to consider: No high-impacting economic events.
Levels to watch/live orders:
- Buys: 1.2736/1.2750 (stop loss: at least five pips beyond the lower edge of the area). Watch for price to engulf 1.2844 and then look to trade any retest seen thereafter ([waiting for a H4 bull candle to form following the retest is advised] stop loss: ideally beyond the candle’s tail).
- Sells: Flat (stop loss: N/A).
AUD/USD
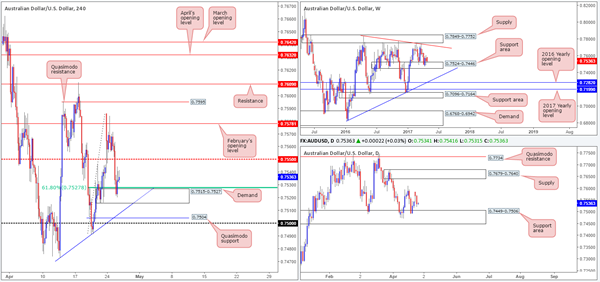
Helped by US dollar weakness, the commodity currency found a pocket of bids around H4 demand at 0.7515-0.7527, which happens to fuse together with a H4 61.8% Fib support at 0.7527 (taken from the low 0.7491). Despite this, the bulls appear to be struggling to register any noteworthy moves from here, with an array of H4 selling wicks seen forming overhead.
Climbing up to the weekly chart, the bulls have so far failed to generate anything of note out of the support area marked at 0.7524-0.7446. There’s not much difference seen on the daily chart as price is currently trading from a support area at 0.7449-0.7506 seen lodged within the said weekly support area at 0.7449-0.7506.
Our suggestions: We see very little to hang our hat on here this morning. Even if the weekly and daily charts emphasized strong buying pressure, a long from the current H4 demand would be difficult from a risk/reward perspective, given how close the H4 mid-level resistance is at 0.7550. Therefore, opting to stand on the sidelines today may very well be the better path to take.
Data points to consider: Aussie inflation data at 2.30am GMT+1.
Levels to watch/live orders:
- Buys: Flat (stop loss: N/A).
- Sells: Flat (stop loss: N/A).
USD/JPY
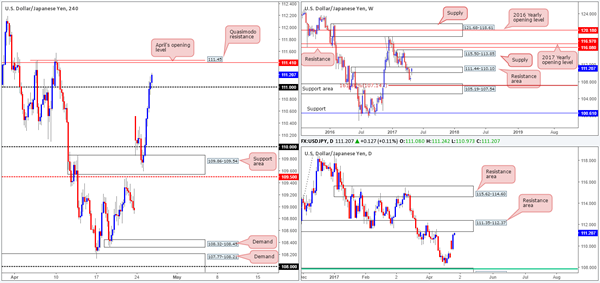
The value of the US dollar strengthened in aggressive fashion against the Japanese yen yesterday, despite US consumer confidence coming in lower than expected. As can be seen from the H4 chart, the day ended with price closing above the 111 handle. Should the bulls remain in the driving seat here, there’s a good chance that the pair will strike April’s opening level at 111.41/Quasimodo resistance at 111.45.
Our suggestions: To make a long story short, our desk has placed a pending sell order at 111.41 with a stop set at 111.60 (above the H4 Quasimodo apex). Our rationale behind this simply comes from seeing the two H4 levels positioned around not only a weekly resistance area at 111.44-110.10, but also a daily resistance area coming in at 111.35-112.37.
The first take-profit target is set at 111, and upon a decisive close seen beyond this number, we’ll be looking to initiate a trailing stop.
Data points to consider: No high-impacting economic events.
Levels to watch/live orders:
- Buys: Flat (stop loss: N/A).
- Sells: 111.41 ([pending order] stop loss: 111.60).
USD/CAD
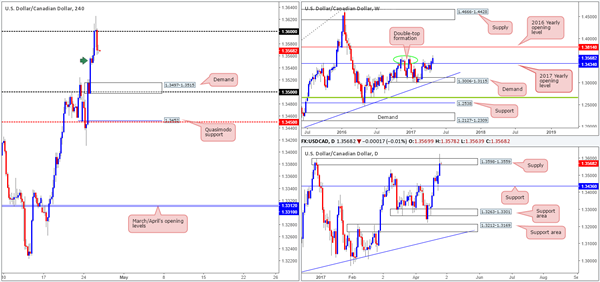
During the course of yesterday’s sessions the USD/CAD aggressively punched its way through 1.36 and tapped a high of 1.3626, before collapsing lower. Although the nearby H4 demand seen marked with a green arrow at 1.3545-1.3559 could hold price higher today, it is not this area that we’re interested in. It’s the H4 demand base seen below that’s wrapped around the 1.35 handle at 1.3497-1.3515.
Here’s the idea. The weekly chart shows that price is not only respecting the 2017 yearly opening level at 1.3434 as support, it also recently broke above a well-defined double-top formation seen around the 1.3588 neighborhood (green circle). The daily supply at 1.3598-1.3559 currently in play, which was also aggressively spiked yesterday, will likely help in pushing things down to our H4 demand.
Our suggestions: Wait and see if H4 price can stretch down to H4 demand at 1.3497-1.3515. Dependent on the time of day, a long from here without the need for additional confirmation is possible.
Data points to consider: Canadian retail sales at 1.30pm, Crude oil inventories at 3.30pm GMT+1.
Levels to watch/live orders:
- Buys: 1.3497-1.3515 ([dependent on the time of day, a long from here without the need for additional confirmation is possible] stop loss: 1.3495).
- Sells: Flat (stop loss: N/A).
USD/CHF
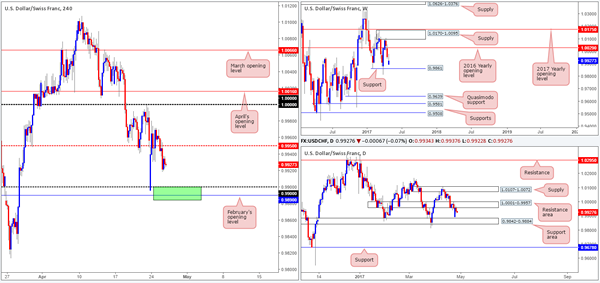
H4 bulls, as you can see, were unable to sustain gains above the mid-level resistance at 0.9950 yesterday. Price closed below the number amid the early hours of London and sold off from this region going into the opening of the US segment, eventually bringing price down to a low of 0.9918. Given this factor, the nearby 0.99 handle may very well come into play today. 0.99 is an interesting number. Not only because it is likely being watched by the majority of the market, but also for the reason that it is seen positioned nearby February’s opening level at 0.9890 and the top edge of a daily support area at 0.9842-0.9884 (green area). The only grumble we would have if we were to take a long position from this area is the fact that weekly price could potentially push the market through our H4 buy zone to shake hands with support at 0.9861.
Our suggestions: Watch for H4 price to attack the 0.9884/0.9900 region today. Should this come to fruition, and price chalks up a reasonably sized H4 bull candle (preferably a full-bodied candle), then our team would have no hesitation in pressing the buy button. As of this point it is difficult to pin-point a take-profit target since we are yet to see the approach.
Data points to consider: No high-impacting economic events.
Levels to watch/live orders:
- Buys: 0.9884/0.99 ([waiting for a reasonably sized H4 bull candle to form before pulling the trigger is advised] stop loss: ideally beyond the candle’s tail).
- Sells: Flat (stop loss: N/A).
DOW 30
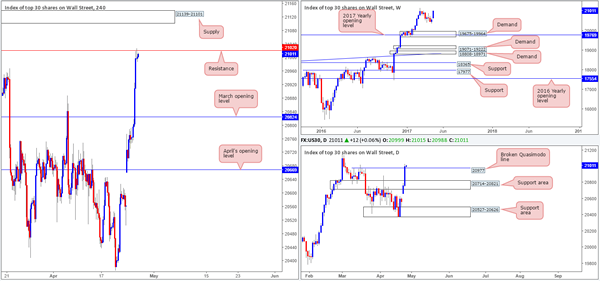
The DOW aggressively climbed higher on Tuesday, following Monday’s rally. Several H4 tech resistances were wiped out during the bullish onslaught, with H4 price not stabilizing until reaching resistance drawn from 21020. Over on the daily candles, the unit crossed above a Quasimodo resistance at 20977 thanks to the recent advance. In the event that this line is now respected as support, we could potentially see US equities pop to fresh highs sometime this week.
Our suggestions: An ideal scenario would be to see H4 price print a decisive close beyond resistance at 21020. This – coupled with a retest and a reasonably sized H4 bull candle (preferably a full-bodied close) would, in our opinion, be enough to validate a long trade here, targeting H4 supply at 21139-21101, and then possibly on to fresh record highs.
Data points to consider: No high-impacting economic events.
Levels to watch/live orders:
- Buys: Watch for H4 price to engulf H4 resistance at 21020 and then look to trade any retest seen thereafter ([waiting for a H4 bull candle to form following the retest is advised] stop loss: ideally beyond the candle’s tail).
- Sells: Flat (stop loss: N/A).
GOLD
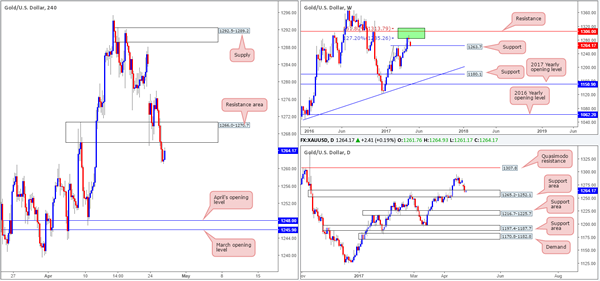
Kicking this morning’s report off with a look at the weekly chart, it’s relatively easy to see what side is in control at the moment. Weekly bears, after engaging with the two Fibonacci extensions 161.8/127.2% at 1313.7/1285.2 taken from the low 1188.1 (green zone), have brought the yellow metal down to a support level drawn in at 1263.7. The story on the daily chart, nevertheless, shows the candles to be trading within the walls of a support area at 1265.2-1252.1 (encapsulates the said weekly support level). However, should the H4 resistance area at 1266.0-1270.7 hold ground today, this could spell trouble for the bulls.
Our suggestions: Neither a long nor short seems attractive at this time. While entering long would see you trading in line with the current weekly support level and daily support area, it would also mean buying into a H4 resistance zone! By the same token, a short from the H4 resistance area would potentially position you against weekly and daily flow. So, we have come to the conclusion that remaining flat for the time being may be the better path to take.
Levels to watch/live orders:
- Buys: Flat (stop loss: N/A).
- Sells: Flat (stop loss: N/A).