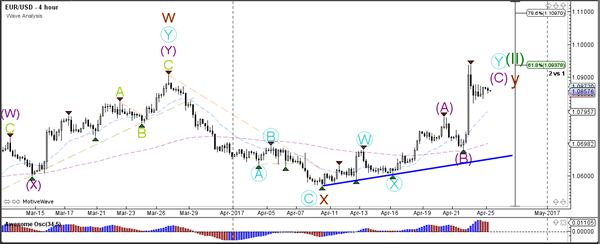
Currency pair EUR/USD
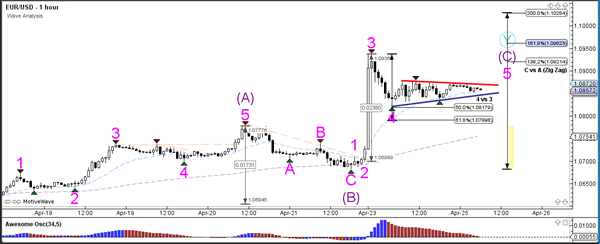
The EUR/USD is moving sideways and respecting the 61.8% Fibonacci resistance level of wave 2 (green). A bullish break could see price build an extension towards the 78.6% Fibonacci level.
The EUR/USD bounced at the 50% Fibonacci support level and most likely in a wave 4 (pink) correction. A break above the resistance (red) could price continue with a wave 5 (pink) where a break below support (blue) could indicate a larger bearish retracement.
Currency pair GBP/USD
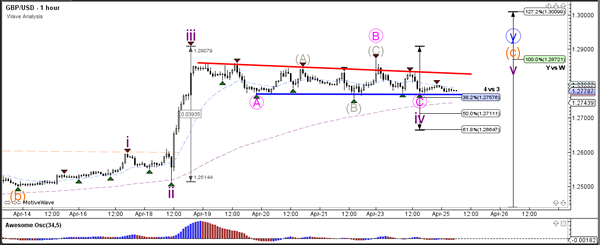
The GBP/USD continues to build a bull flag chart pattern (red/blue lines). A break above it could see price challenge the next Fibonacci level.
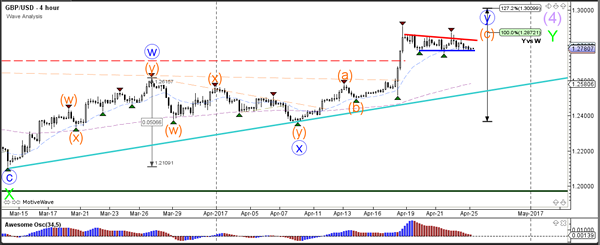
The GBP/USD retracement still stays above the 38.2% Fibonacci retracement level at 1.2750. A break below the 61.8% Fibonacci level invalidates wave 4 (purple) where a break above the bull flag (red) could see a wave 5 (purple) develop.
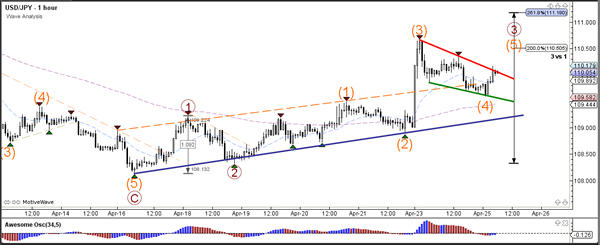
Currency pair USD/JPY
The USD/JPY bullish breakout could see a continued bullish extension within wave 3 (brown).
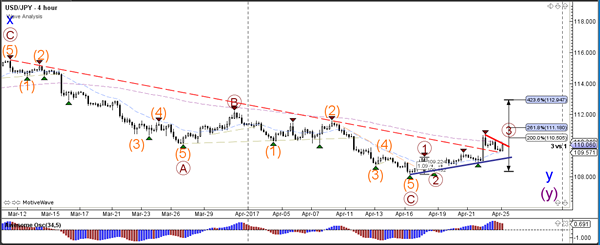
The USD/JPY is building a bull flag chart pattern (red/green lines). A breakout above resistance (red) could see price complete a wave 5 (orange).