
A note on lower timeframe confirming price action…
Waiting for lower timeframe confirmation is our main tool to confirm strength within higher timeframe zones, and has really been the key to our trading success. It takes a little time to understand the subtle nuances, however, as each trade is never the same, but once you master the rhythm so to speak, you will be saved from countless unnecessary losing trades. The following is a list of what we look for:
- A break/retest of supply or demand dependent on which way you’re trading.
- A trendline break/retest.
- Buying/selling tails – essentially we look for a cluster of very obvious spikes off of lower timeframe support and resistance levels within the higher timeframe zone.
- Candlestick patterns. We tend to only stick with pin bars and engulfing bars as these have proven to be the most effective.
EUR/USD
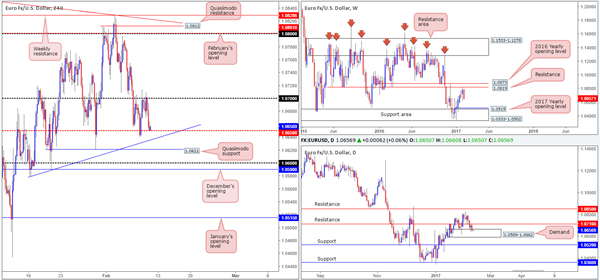
Using a top/down approach this morning, the weekly candle is currently seen trading with a reasonably strong downside bias at the moment after topping around weekly resistance at 1.0819. Providing that the bears remain in the driving seat here, the next weekly support target on tap can be seen at a weekly support area drawn from 1.0333-1.0502. Down on the daily timeframe, however, we have a daily demand zone at 1.0589-1.0662 in play at the moment. Despite this base managing to hold the market higher since Jan 26 2017, nearby daily resistance at 1.0710 is proving troublesome to overcome!
Swinging across to the H4 candles, we can see that the single currency failed to sustain gains beyond the 1.07 handle yesterday, and swiftly sold off going into the London open. Likely fueled by comments from President Trump regarding a tax reform, the pair ended the day testing the H4 mid-level support at 1.0650.
Our suggestions: Although 1.0650 is seen bolstered by a nearby H4 trendline support etched from the low 1.0579, we’re cautious about looking to buy from here again. The main reason being is that the daily bulls are now reflecting a bearish stance within the above noted daily demand, and the weekly bears look determined to stamp this market lower (see above). To that end, our team is going to be taking the safest position of them all today – flat!
Data points to consider: US Prelim UoM consumer sentiment scheduled for release at 3pm GMT.
Levels to watch/live orders:
- Buys: Flat (stop loss: N/A).
- Sells: Flat (stop loss: N/A).
GBP/USD
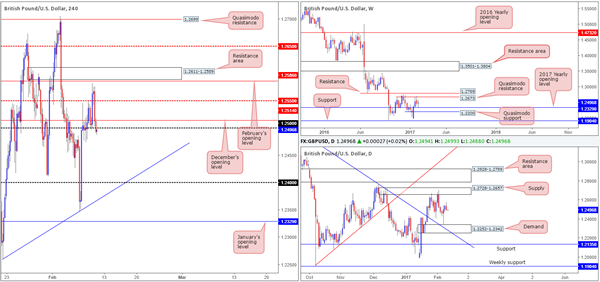
On the back of comments made by President Trump concerning a tax reform the greenback advanced northbound yesterday, consequently dragging the GBP lower. Missing February’s opening line by a hair at 1.2586 the pair aggressively tumbled lower into the US open, taking out the H4 mid-level support at 1.2550, December’s opening level at 1.2514 and also the 1.25 handle. Beyond this psychological boundary, we see little standing in the way of a move back down to the 1.24 neighborhood.
Looking across to the weekly candles, the unit is currently seen trading mid-range between the 2017 yearly opening level at 1.2329 and a weekly Quasimodo resistance coming in at 1.2673. By the same token, a similar pattern is being seen on the daily chart as price is seen loitering between daily demand at 1.2252-1.2342 and a daily supply penciled in at 1.2728-1.2657.
Our suggestions: On account of the above, if H4 price manages to remain below the 1.2514/1.25 region today, the door looks open for further selling, in our opinion. To take advantage of this move, however, we’d require additional confirmation in the form of a reasonably sized H4 bearish candle off the underside of 1.2514/1.25.
Data points to consider: UK manufacturing production at 9.30am. US Prelim UoM consumer sentiment scheduled for release at 3pm GMT.
Levels to watch/live orders:
- Buys: Flat (stop loss: N/A).
- Sells: 1.2514/1.25 ([wait for a H4 bear candle to form before looking to execute a trade] stop loss: ideally beyond the trigger candle).
AUD/USD
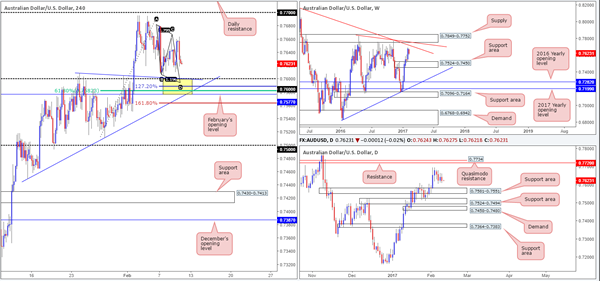
Although the pair ranged over 50 pips during the course of yesterday’s sessions and managed to erase Wednesday’s gains, there has been very little change seen to the structure of this market. Given this, our desk remains drawn to the 0.7577/0.76 H4 support area (yellow zone) today. Supporting a bounce from this area we have the following converging structures:
- A H4 AB=CD 127.2% ext. at 0.7589.
- Two H4 trendline supports (0.7449/0.7609).
- A H4 61.8% Fib support at 0.7582.
- February’s opening level at 0.7577.
- Round number 0.76.
- We also have the top edge of a daily support area at 0.7581 bolstering the above noted H4 support zone.
Our suggestions: Based on the above confluence, we feel a long from the 0.7589 mark is feasible. To be on the safe side though, stops may want to be placed beyond the H4 161.8% ext. at 0.7562 (0.7564).
Data points to consider: Reserve Bank of Australia’s monetary policy statement at 12.30am. Chinese trade balance figures (tentative). US Prelim UoM consumer sentiment scheduled for release at 3pm GMT.
Levels to watch/live orders:
- Buys: 0.7577/0.76 ([an area that can, dependent on the time of day, possibly be traded without additional confirmation] stop loss: 0.7562).
- Sells: Flat (stop loss: N/A).
USD/JPY
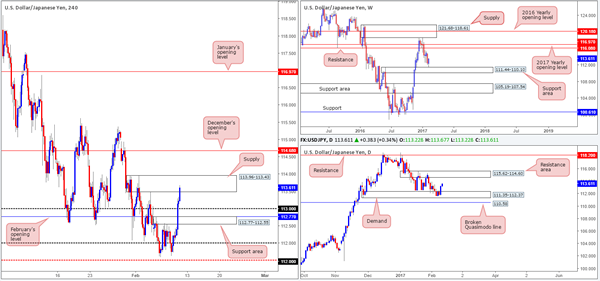
The USD/JPY soared to fresh weekly highs yesterday, following comments made by President Trump regarding a tax reform. The pair broke through several H4 tech resistances and managed to clock highs of 113.34 going into the close. As we write, the H4 candles are currently seen testing a H4 supply zone drawn in at 113.96-113.43. While this area may hold the market lower today, both the weekly and daily timeframes suggest that this zone is extremely vulnerable. From the weekly chart, the weekly support area at 111.44-110.10 was very nearly brought into play recently (missed clipping the top edge of this zone by 10 or so pips). In a similar fashion, daily demand at 111.35-112.37 managed to remain stable, which happens to be positioned around the top edge of the weekly zone mentioned above. The closest upside target on the higher timeframes can be seen on the daily chart at 115.62-114.60: a resistance area that has managed to hold price lower on two occasions already.
Our suggestions: On the whole, we have no intention of becoming buyers in this market until the current H4 supply area is consumed. Beyond this area, we see space for price to challenge December’s opening base at 114.68, which, as you can probably see, is located within the lower edge of the aforementioned daily resistance area. Should a H4 close take shape above the H4 supply today, and is followed up with both a retest and a lower-timeframe buy signal (see the top of this report), our desk would look to buy, targeting the 114.68 boundary.
Data points to consider: US Prelim UoM consumer sentiment scheduled for release at 3pm GMT.
Levels to watch/live orders:
- Buys: Watch for a H4 close above 113.96-113.43 and then look to trade any retest seen thereafter ([waiting for a lower-timeframe signal to form following the retest is advised before pulling the trigger] stop loss: dependent on where one confirms this zone).
- Sells: Flat (stop loss: N/A).
USD/CAD
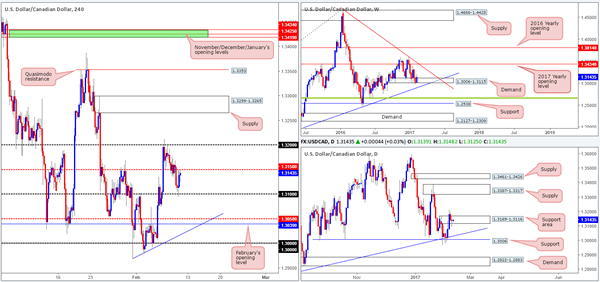
Coming in from the top this morning, weekly demand at 1.3006-1.3115 is still seen very much in play. The next upside target from this angle comes in at a weekly trendline resistance extended from the high 1.4689. A break below, nevertheless, would place a nearby weekly trendline support etched from the high 1.1278 in the firing range. The story on the daily chart shows us that a daily support area at 1.3169-1.3116 is currently holding the market higher. This area does look a tad vulnerable, however, given yesterday’s daily indecision candle. Over on the H4 chart, the pair caught a fresh bid off the 1.32 handle as the market entered into the US segment, which, as you can see, lifted the loonie up to just ahead of the H4 mid-way resistance at 1.3150 by the day’s end.
Our suggestions: Selling from 1.3150 would not be a comfortable trade for us, due to where the weekly action is presently situated (see above). With that in mind, we would consider a buy trade should a H4 close above 1.3150 take form. As long as price follows through with a retest to this level as support and a lower-timeframe buy signal (see the top of this report), we would confidently long this market, targeting 1.32 as an initial take-profit zone.
Data points to consider: Canadian employment data at 1.30pm. US Prelim UoM consumer sentiment scheduled for release at 3pm GMT.
Levels to watch/live orders:
- Buys: Watch for a H4 close above 1.3150 and then look to trade any retest seen thereafter ([waiting for a lower-timeframe buy signal to form following the retest is advised before pulling the trigger] stop loss: dependent on where one confirms this level).
- Sells: Flat (stop loss: N/A).
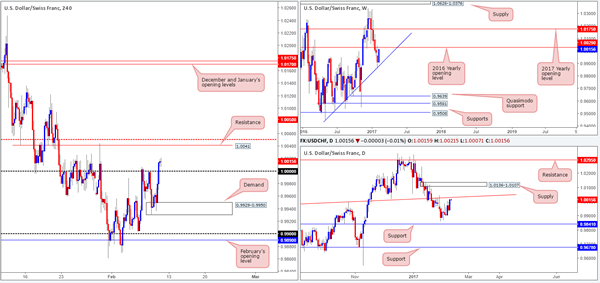
USD/CHF
The USD/CHF is seen marginally stronger today after enduring and finally conquering parity (1.0000) yesterday. Across the board, we saw the US dollar advance on comments made by President Trump regarding tax. While there is likely a truckload of buyers now long this market following the break of parity, both the weekly and daily charts seem to be throwing up red flags here! Weekly action is trading within a stone’s throw away from the 2016 yearly opening level at 1.0029, and price is seen positioned within an inch of a daily trendline resistance etched from the high 0.9956. Therefore, there may be trouble ahead for those breakout buyers! Personally, we would not look to go long here until parity has been successfully retested as support. Even then though, it’s still an incredibly risky play knowing that higher-timeframe resistance is lurking just ahead.
Our suggestions: Should price strike the higher-timeframe areas noted above today, we do not think it’ll be long before price is trading back below parity. In the event that this comes to fruition today, a short could be possible down to H4 demand at 0.9929-0.9950.
Data points to consider: US Prelim UoM consumer sentiment scheduled for release at 3pm GMT.
Levels to watch/live orders:
- Buys: Flat (stop loss: N/A).
- Sells: Watch for a H4 close below 1.0000 and then look to trade any retest seen thereafter ([waiting for a lower-timeframe sell signal to form following the retest is advised before pulling the trigger] stop loss: dependent on where one confirms this level).
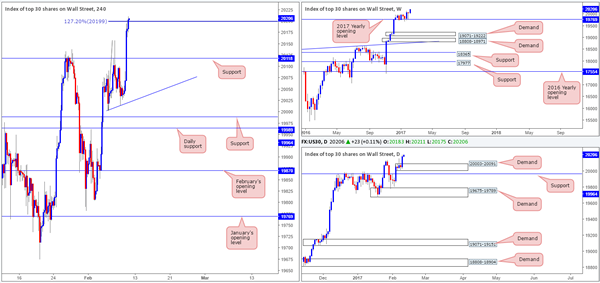
DOW 30
US equities aggressively rose to the upside going into yesterday’s US segment, reaching a record high of 20203. As we write, the H4 candles are seen tackling the 127.2% H4 ext. at 20199 taken from the low 20003. Despite this, the bulls still seem to have the upper hand here which may lead to further buying up to the 161.8% H4 ext. at 20252 today. Apart from these Fib resistances, given that we’re trading at record highs, there is absolutely no resistance seen on the horizon on the bigger picture.
Our suggestions: Although we absolutely love the 127.2/161.8% Fib levels, shorting into the current buying strength is just too risky, in our humble opinion. Therefore, unless price retests the H4 support at 20118 sometime during the day, opting to stand on the sidelines here may be the better path to take.
Data points to consider: US Prelim UoM consumer sentiment scheduled for release at 3pm GMT.
Levels to watch/live orders:
- Buys: 20118 region ([wait for a H4 bull candle to form before looking to execute a trade] stop loss: ideally beyond the trigger candle).
- Sells: Flat (stop loss: N/A).
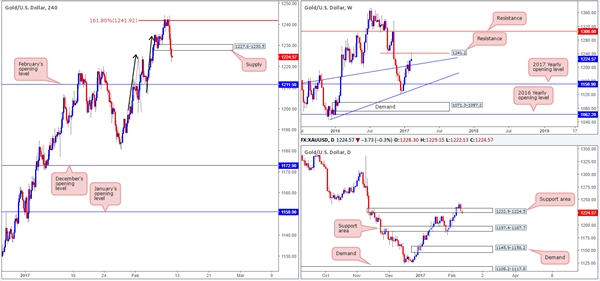
GOLD
For those who read Thursday’s report on the yellow metal you may recall our team highlighting a short position we took from 1239.6, with a stop logged in at 1245.4. As you can see, the trade worked out beautifully, despite quite severe drawdown. We have taken 70% off the table at the H4 demand area at 1227.6-1230.5 and reduced risk to breakeven. Our next port of call will be February’s opening base at 1211.5, followed by the daily support area at 1197.4-1187.7. Well done to any of our readers who also jumped on board this trade!
Our suggestions: For those traders who missed this recent short opportunity, there could be a second chance to get in on any retest seen to the underside of the recently broken H4 demand as supply. However, caution is advised since we have yet to clear the daily support area coming in at 1197.4-1187.7. For us personally, we’re happy with our current position at the moment and will not look to pyramid here.
Levels to watch/live orders:
- Buys: Flat (stop loss: N/A).
- Sells: 1239.6 ([live order] stop loss: breakeven).