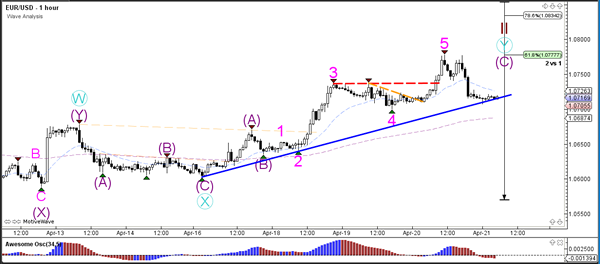
Currency pair EUR/USD
In yesterday’s trading the EUR/USD broke above the 50% Fibonacci retracement level of wave 2 (brown) and continued with a bullish push towards the 61.8% Fib at 1.0775. Price stopped at this Fib level and made a bearish retracement, which is now testing the support trend line (blue) – see 1 hour chart.
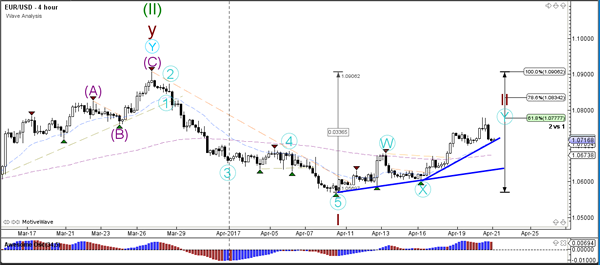
The EUR/USD completed a wave 5 (pink) as expected in yesterday’s wave analysis. Price is now at the trend line (blue) which is a bounce or break spot. A bearish break could indicate a first signal that a bearish reversal is occurring.
Currency pair EUR/USD
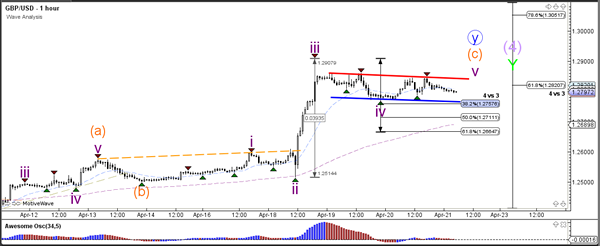
The GBP/USD remains at the 61.8% Fibonacci level of wave 4 (purple). The consolidation zone could indicate a potential reversal or a sideways zone for a new bullish breakout towards the 78.6% Fibonacci level.
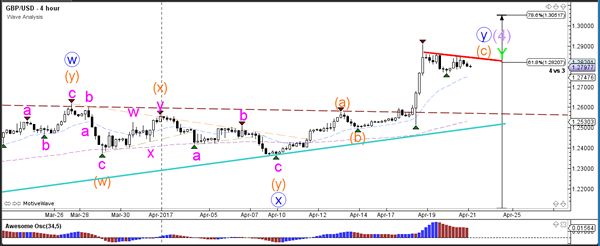
The GBP/USD retracement is a bull flag chart pattern which has reached the 38.2% Fibonacci retracement level at 1.2750. A break below the 61.8% Fibonacci level invalidates wave 4 (purple) where a break above the bull flag (red) could see a wave 5 (purple) develop.
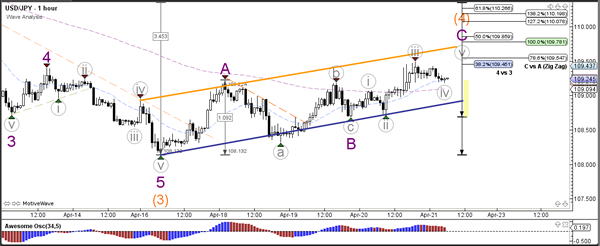
Currency pair USD/JPY
The USD/JPY is building a bear flag chart pattern within a wave 4 correction (orange), which would become invalid if price retraced above the bottom of wave 1 (red line). A break below the bottom of the bull flag (blue) could indicate a bearish breakout and completion of wave 4 (orange).
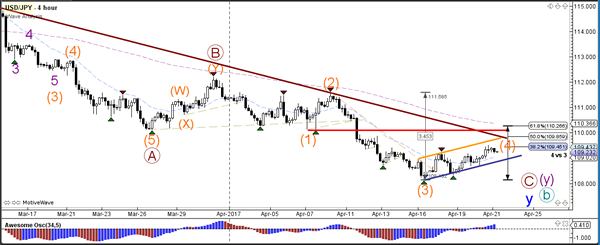
The USD/JPY is building an ABC (purple) zigzag correction towards the Fibonacci levels of wave 4 (orange).