
A note on lower timeframe confirming price action…
Waiting for lower timeframe confirmation is our main tool to confirm strength within higher timeframe zones, and has really been the key to our trading success. It takes a little time to understand the subtle nuances, however, as each trade is never the same, but once you master the rhythm so to speak, you will be saved from countless unnecessary losing trades. The following is a list of what we look for:
- A break/retest of supply or demand dependent on which way you’re trading.
- A trendline break/retest.
- Buying/selling tails … essentially we look for a cluster of very obvious spikes off of lower timeframe support and resistance levels within the higher timeframe zone.
- Candlestick patterns. We tend to only stick with pin bars and engulfing bars as these have proven to be the most effective.
EUR/USD
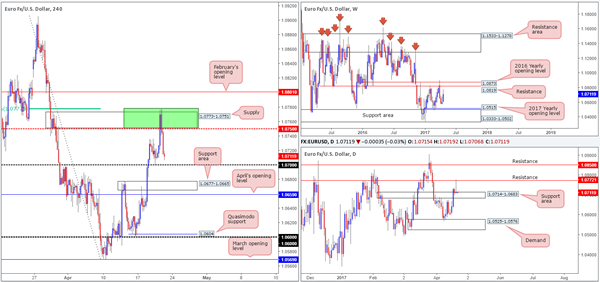
As we highlighted in Thursday’s report, the single currency was likely to find resistance within the H4 (green) sell zone at 1.0777/1.0750. The area comprised of a H4 supply zone at 1.0773-1.0751, a H4 mid-level resistance at 1.0750 and a H4 61.8% Fib resistance at 1.0777 (taken from the high 1.0905). Also of note was the daily resistance found within the upper limits of the said H4 supply base at 1.0772.
H4 price, as you can see, aggressively drove into the jaws of this zone and crossed swords with both the noted H4 61.8% resistance and daily resistance, before turning lower and closing the day ahead of the 1.07 handle. Although this move chalked up a nice-looking daily selling wick, sellers now not only have to contend with the 1.07 figure, they also have to compete with a daily support area seen in play at 1.0714-1.0683.
Our suggestions: Technically speaking, there’s limited downside potential seen in this market at the moment. Even if 1.07 is cleared, there’s a nearby H4 support area seen at 1.0677-1.0665, as well as the daily support area that’s already in motion.
With that, what about considering longs from 1.07 given the current daily support area? This could be an option, although, we would prefer to see more H4 confluence fusing with 1.07. To be on the safe side, we’d highly recommend waiting for a reasonably sized H4 bull candle to form before committing. That way, price has a good chance of at least achieving 1.0750.
Data points to consider: Eurozone manufacturing at 8-9am. FOMC member Kashkari speaks at 2.30pm GMT+1.
Levels to watch/live orders:
- Buys: 1.07 region ([waiting for a reasonably sized H4 bull candle to form before pulling the trigger is advised] stop loss: ideally beyond the candle’s tail).
- Sells: Flat (stop loss: N/A).
GBP/USD:
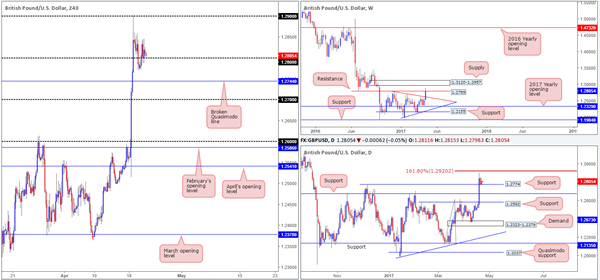
In view of the pair trading nearby a key weekly support level at 1.2789, further buying could be a struggle. In conjunction with this notion, daily price is seen consolidating below a Fib 161.8% extension at 1.2920 drawn from the low 1.2108. However, let’s be mindful to the fact that nearby support has also been established from the 6th December high around 1.2774.
Over on the H4 candles, yesterday’s flow managed to reclaim the 1.28 handle which is currently offering intraday support as we write. Entering long from this psychological number based on daily support mentioned above is chancy, owing to the aforementioned weekly resistance. In regard to shorts, a daily close below 1.2774 is required before we look at committing.
Our suggestions: As of this time, we do not see a lot to hang our hat on at the moment given the clear difference of opinion being seen from the higher-timeframe structures. Therefore, remaining on the sidelines may be the better path to take.
Data points to consider: UK retail sales at 9.30am, MPC member speaks at 12.45pm. FOMC member Kashkari speaks at 2.30pm GMT+1.
Levels to watch/live orders:
- Buys: Flat (stop loss: N/A).
- Sells: Flat (stop loss: N/A).
AUD/USD
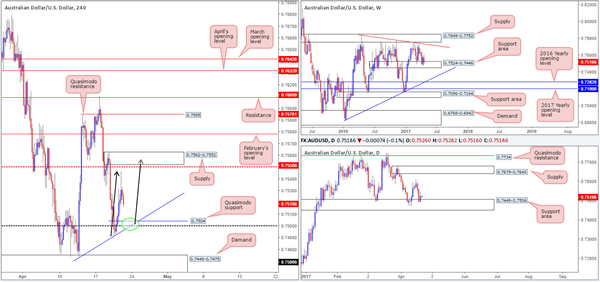
The Aussie managed to recoup some of Wednesday’s losses yesterday, as the bulls reclaimed the 0.75 number in early trading. Bolstering the move is both a weekly support area seen at 0.7524-0.7446 and a daily support area housed within at 0.7449-0.7506.
On account of the higher timeframes, the H4 candles may look to extend the current pullback and test the Quasimodo support at 0.7504 (green circle), since it also boasts the 0.75 handle and a trendline support extended from the low 0.7472. A bounce from this area could also encourage the couple to complete the D-leg to an AB=CD formation (see black arrows) which would terminate around supply at 0.7562-0.7552.
Our suggestions: Assuming one is able to enter with a reasonable stop around the 0.75 neighborhood, the risk/reward should be at least 1:2 up to 0.7550. Personally, we’d recommend waiting for a H4 (preferably with a full-bodied close) bull candle to form and enter based on this momentum with stops positioned below the tail.
Data points to consider: FOMC member Kashkari speaks at 2.30pm GMT+1.
Levels to watch/live orders:
- Buys: 0.75 region ([waiting for a reasonably sized H4 bull candle to form before pulling the trigger is advised] stop loss: ideally beyond the candle’s tail).
- Sells: Flat (stop loss: N/A).
USD/JPY
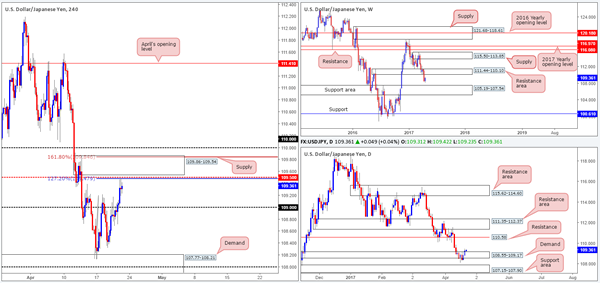
The USD/JPY extended higher for a second consecutive day on Thursday, forcing price to clear the 109 handle and shake hands with a H4 AB=CD 127.2% Fib ext. at 109.47 (taken from the low 108.13) going into the closing bell. Supporting this AB=CD base is a H4 mid-way barrier at 109.50, a H4 supply area at 109.86-109.54 and a H4 AB=CD 161.8% Fib ext. at 109.84.
Selling from the above noted area may very well be inviting due to its confluence, but we‘re cautious. Throwing the higher timeframes into the mix shows that daily price is currently trading from demand at 108.55-109.17 and has room to advance up to resistance at 110.58. Furthermore, weekly movement reveals there’s little resistance in view until price connects with the underside of a resistance area at 111.44-110.10. And considering that the 110 handle sits above our chosen H4 sell zone, this could eventually lead to a fakeout taking place.
Our suggestions: Trading short with absolutely no higher-timeframe structure is chancy, and not really something our team is comfortable with. However, if the noted H4 zone is something you can work with, you may want to consider waiting for a H4 bearish candle to form (preferably with a full-bodied close) before pulling the trigger.
Data points to consider: FOMC member Kashkari speaks at 2.30pm GMT+1.
Levels to watch/live orders:
- Buys: Flat (stop loss: N/A).
- Sells: 109.86/109.47 (possible area to consider shorting from – waiting for a H4 bearish candle to form [preferably with a full-bodied close] is advised – stop loss: ideally beyond the candle’s wick).
USD/CAD
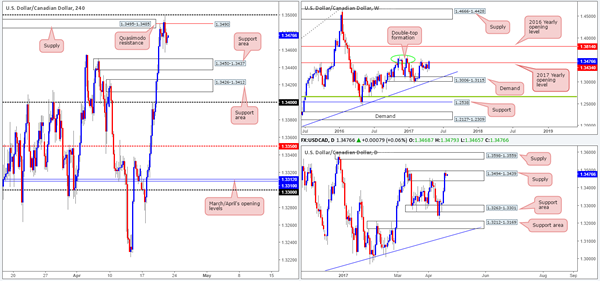
For those who read Thursday’s report you may recall that we showed interest in shorting from the 1.35 handle. Ultimately, we wanted to see H4 price print a selling wick that pierced above the H4 supply at 1.3495-1.3485 into 1.35. While this did come to fruition, we chose not to enter for the simple reason that the same H4 candle also boasted an incredibly large buying tail as well.
Having seen 1.35 hold ground, a retest of the H4 support area at 1.3450-1.3437 is a reasonable possibility, in our opinion. Even more so considering that daily price remains trading within the walls of a supply at 1.3494-1.3439, and weekly price is seen trading nearby a strong-looking double-top formation around the 1.3530 neighborhood (see green circle).
Our suggestions: Watch for price to pullback and test the H4 Quasimodo resistance at 1.3490. Ideally, we do not want to see price test the aforementioned H4 support area before striking this level as this would be the first take-profit target. Also, as price could possibly test the 1.35 handle again, we would advise waiting for a H4 bearish candle to form (preferably with a full-bodied close) before pulling the trigger.
Data points to consider: FOMC member Kashkari speaks at 2.30pm. Canadian inflation data at 1.30pm GMT+1.
Levels to watch/live orders:
- Buys: Flat (stop loss: N/A).
- Sells: 1.3490 region ([waiting for a reasonably sized H4 bear candle to form before pulling the trigger is advised] stop loss: ideally beyond the candle’s wick).
USD/CHF
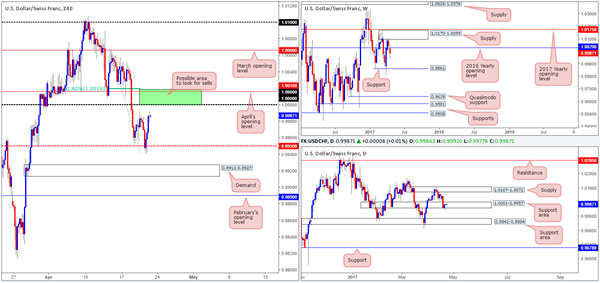
During the course of yesterday’s sessions, H4 price caught a fresh bid off the mid-level support at 0.9950 which eventually saw the unit tackle Wednesday’s high 0.9992. In light of this, it’s highly likely that the candles will bump heads with parity (1.0000) today. Nearby notable features here is April’s opening level at 1.0016 as well as the 61.8% Fib retracement at 1.0019. Collectively, these levels form a promising sell zone (green area).
With weekly price still seen trading below the 2016 yearly opening level at 1.0029, the bears could potentially continue pumping the pair down to support penciled in at 0.9861. On the other side of the coin, however, bids remain defensive on the daily chart from the support zone drawn in at 1.0001-0.9957.
Our suggestions: A retest of 1.0019/1.0000 (green zone) would, if a reasonably sized H4 bearish candle took shape (preferably with a full-bodied close), be a relatively nice place to short from given weekly flow. The reason for requiring a confirming bearish candle prior to entry is simply due to the fact that daily buyers could push this market higher.
Data points to consider: FOMC member Kashkari speaks at 2.30pm GMT+1.
Levels to watch/live orders:
- Buys: Flat (stop loss: N/A).
- Sells: 1.0019/1.0000 ([waiting for a reasonably sized H4 bear candle to form before pulling the trigger is advised] stop loss: ideally beyond the candle’s wick).
DOW 30
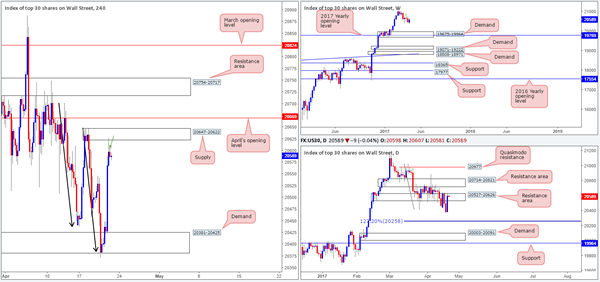
Following a 1:1 downside move seen on the H4 chart (see black arrows), US equities rose higher on Thursday resulting in price testing supply coming in at 20647-20622. Directly above this barrier is April’s opening base line at 20669, while to the downside we see very little noteworthy support until demand at 20381-20425.
Swinging across to the bigger picture, we can see that daily movement is retesting the resistance area at 20527-20626 for the second time this week. The next downside target from this angle sits at 20258: an AB=CD 127.2 Fib ext. taken from the high 21022. Weekly flow on the other hand, still looks poised to extend the pullback seen from record highs of 21170 down to 19675-19964: a demand area that’s bolstered by the 2017 yearly opening level at 19769.
Our suggestions: According to our technicals, the bears have the upper hand at the moment. As such, we have entered short on the close of the bearish candle seen marked with a green arrow, with stops planted above the supply at 20649 and an overall take-profit target set at the above said H4 demand.
Data points to consider: FOMC member Kashkari speaks at 2.30pm GMT+1.
Levels to watch/live orders:
- Buys: Flat (stop loss: N/A).
- Sells: 20586 ([live position] stop loss: 20649).
GOLD:
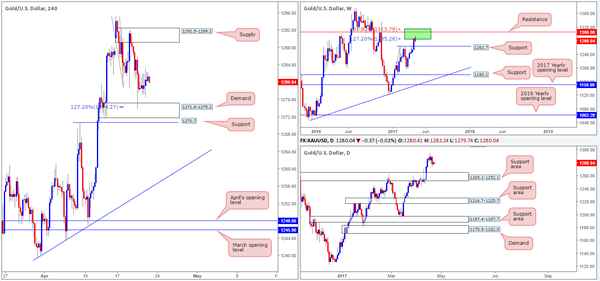
Following Wednesday’s bounce from the H4 AB=CD 127.2% ext. at 1274.2 (housed within a H4 demand area at 1271.8-1275.2), gold prices are little changed this morning. Therefore much of the following report will echo similar thoughts put forward in yesterday’s analysis…
Although the H4 demand zone has already done a fine job of supporting the bulls, both weekly and daily structure show that the bears could remain in control. Weekly flow shows price trading nicely from two Fibonacci extensions 161.8/127.2% at 1313.7/1285.2 taken from the low 1188.1 (green zone), while daily action has room to stretch down to a support area marked at 1265.2-1252.1 (a weekly support line at 1263.7 is seen housed within this daily area which is the next downside target on the weekly scale).
Our suggestions: Given the little change, we do not see much to go on at the moment. Here’s why:
A long would, of course, place one against potential weekly and daily sellers.
A short, although supported by higher-timeframe flow, is risky given the current H4 demand and nearby H4 support at 1270.7. Even with a H4 close seen beyond these two areas, price would then be too close to the top edge of the daily support area to consider a sell!
Maybe we’re missing something here, but it seems like we’re trapped at both ends!
Levels to watch/live orders:
- Buys: Flat (stop loss: N/A).
- Sells: Flat (stop loss: N/A).