S&P 500 (cash) near term outlook:
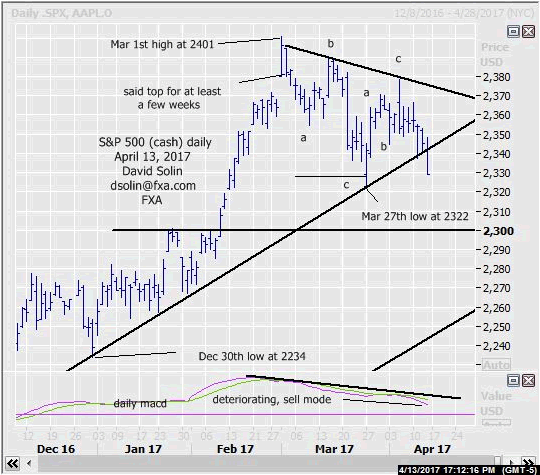
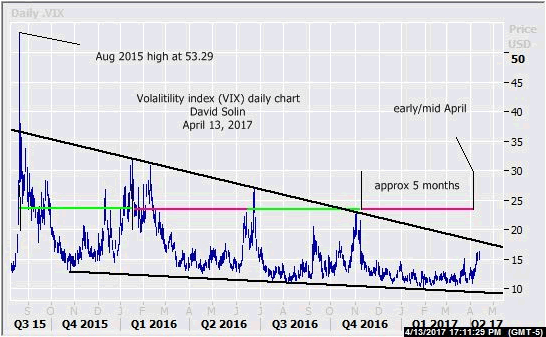
The market has continued to trade in that 2322/2401 range that has been in place since Mar 1st. Note that the sloppy, 3 wave moves (a-b-c’s) in both directions continue to suggest a large correction, and with an eventual resumption of the longer term gains above that 2401 high after. May be forming a large triangle/pennant (3 waves moves in both directions a characteristic) suggesting at least another few weeks of this trading in a tighter and tighter range before resolving higher. Also, lots of support is just below the base of the range at 2322, so even in the case of a break below further downside may be limited. Further support is just below there at 2315/18 (50% from the Dec 30th low at 2234) and 2298/01 (broken Jan 26/Feb 7th highs). And finally, don’t forget about that series of approx 5 month peaks in the VIX which again tops around this time and adds to the view of a nearing low/limited further downside in the s&p 500 (inverse relationship, see 2nd chart below). Nearby resistance is now at the earlier broken bull trendline from Dec (currently at 2341/44) and the bearish trendline from Mar 2nd (currently at 2372/75). Bottom line : sloppy ranging since the Mar 1st high at 2401 still seen as a large correction, but with scope for at least another few weeks of wide ranging (poss triangle) before resuming that larger upmove.
Strategy/position:
Took small profit Mar 27th buy at 2325 today below that bull trendline from Dec 30th (2342, closed at 2329 for 4 pts). For now with the action from Mar 1st seen as a large correction and the market nearing the base, looking to rebuy. However, not yet enough confidence to rebuy here as there is still no confirmation of even a short term low (and larger bottoms begin with smaller ones).
Long term outlook:
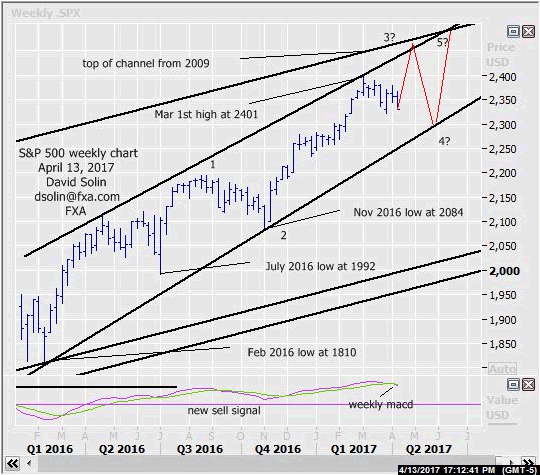
As discussed above, gains past that Mar 1st high at 2401 are still favored but lots of longer term negatives suggest that the bigger picture magnitude may be more limited. An interesting time for the longer term given a real contrast between the upside pattern which is quite far from "completion" (currently seen within wave 3 in the rally from that the July 2016 low) but at a time with lots of other longer term negatives. Those negatives include bearish technicals (sell mode on the weekly macd), overbought market after the huge surge from at least that Nov low at 2084) and lots of long term resistance just above that 2401 high at the rising trendline from Apr 2016 (currently at 2435/40) and that very long term ceiling of the bull channel from 2009 (currently at 2465/75). This in turn suggests at least another few months of potentially wide swings in both directions and marginal new highs as that longer term upside pattern unfolds (see "ideal" scenario in red on weekly chart/2nd chart below). Bottom line : gains above 2401 favored but the bigger picture magnitude may be limited and versus the start of a major, new surge.
Long term strategy/position:
With gains above 2401 favored looking to switch to bullish but in general would have that longer term strategy of fading the wide extremes. Note also switched the bullish bias that was put in place on Apr 7th at 2360 to neutral below that t-line from Mar (then 2342, closed 2329).
Current:
Nearer term : eventual resumption of gains above 2401, looking for signs of near term bottom to buy.
Last : long Mar 27at 2325,took profit Apr 13 below t-line from Dec (2342, closed 2329, 4pts).
Longer term: at least a few months of wide swings in both directions, looking to fade extremes.
Last : same as shorter term above.


