U.S. Review
Solid Job Gains in November, But Wages Disappoint
- Hiring was solid in November with employers adding 228,000 new jobs. The unemployment rate held steady at 4.1 percent, while wage growth rose less than expected.
- The ISM non-manufacturing index fell 2.7 points in November, but remained firmly in expansion territory at 57.4.
- Despite total factory orders slipping 0.1 percent in October, core capital goods orders signaled equipment spending is likely to remain strong in Q4.
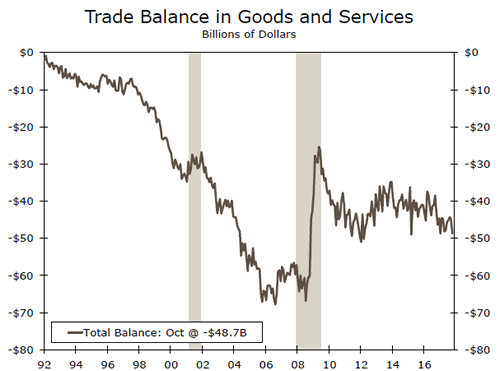
- The trade balance widened by $3.8 billion in October and points toward trade being a drag on GDP growth in Q4.
Solid Job Gains in November, But Wages Disappoint
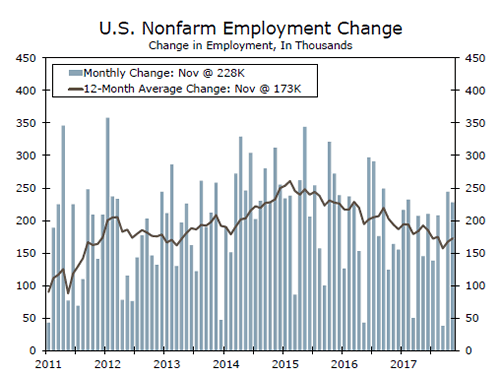
Employers added 228,000 new jobs in November, which was better than expected. The print is particularly encouraging given that the distortions related to the storms this hurricane season have largely dissipated. Gains were widespread across major industries, with only information and federal government employment seeing declines.
Unemployment held steady at 4.1 percent last month but is down from 4.6 percent a year ago. The labor force participation rate was also unchanged at 62.7 percent, which we view positively in light of the aging of the population weighing on overall participation.
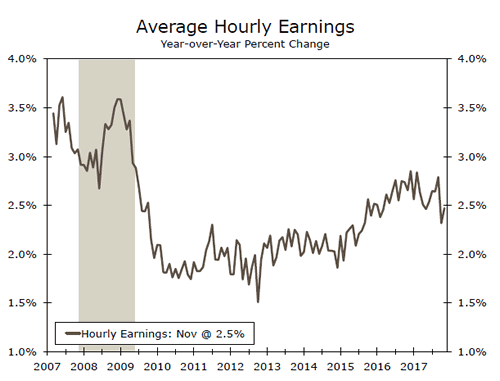
Wage growth remained muted in November. Average hourly earnings rose 0.2 percent, which was short of expectations and followed downward revisions to September and October. The year-over-year rate rose to 2.5 percent, but has weakened since late last year. One offset to the tepid wage growth this month, however, was that workers were offered more hours at work. The average length of the workweek edged up to 34.5 hours, which, along with the net jobs added, suggest income derived from the labor market has strengthened at a 4.7 percent annualized rate the past three months.
Activity Expanding Across Industries
Like the employment report, the November ISM nonmanufacturing index pointed to broad growth across industries. The index slipped 2.7 points, but remained squarely in expansion territory at 57.4. Of 18 industries, only one reported contracting over the month (agriculture & forestry). Most sub-indexes, including new orders, employment, and backlogs, pulled back in November, but remained at levels consistent with a decent pace of growth.
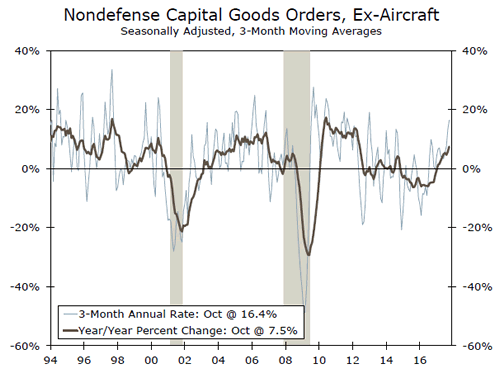
The ISM manufacturing index was released last Friday and showed that factory activity has also remained strong in recent months. This week we got additional insight on the manufacturing sector in the factory orders report. The total value of orders edged down 0.1 percent in October, but this this came on the heels of a solid (and upwardly revised) 1.7 percent gain in September. The negative print for October stemmed largely from a drop in aircraft orders. Nondefense capital goods orders, excluding aircraft—a bellwether of private equipment spending— edged up and have risen at an impressive 16.4 percent three month average-annualized pace. The nondurables segment has also improved in recent months, with shipments rising 0.7 percent in October.
Trade Winds Shifting
A narrowing in the trade deficit has been additive to GDP in recent quarters, but that support looks to be coming to an end. In October, the trade balanced widened by $3.8 billion. Exports stalled over the month, while imports rose 1.6 percent. The trade data are still being affected from the hurricanes this season, so revisions could be larger than usual. That said, we expect that the trade balance will continue to widen on trend in the year ahead as steady domestic demand leads import growth to outpace exports.
U.S. Outlook
CPI • Wednesday
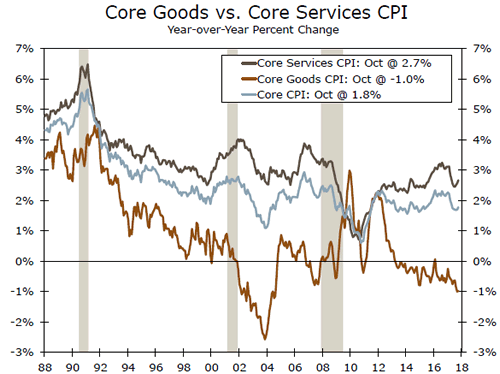
October’s Consumer Price Index (CPI) grew a slower 0.1 percent over the month, pulling the year-over-year rate back to 2.0 percent behind a hurricane-driven pullback in energy prices. However, core inflation, which excludes food and energy, rose to 1.8 percent over the year, and over the past three months has grown at an annualized 2.4 percent rate. Core services was the primary culprit behind inflation weakness earlier in the year, but bounced back in October by 0.3 percent on broad-based gains. On the goods side, used car prices were up a strong 0.7 percent, while medical goods and tobacco products also showed strength.
Our outlook has been that inflation weakness has been caused by unique, transitory factors that have understated the "true" CPI. Many categories that had held back inflation have gained some momentum, which is supportive of a December rate hike and continued, tightening, in our view.
Previous: 0.1% Wells Fargo: 0.4% Consensus: 0.4% (Month-over-Month)
Retail Sales • Thursday
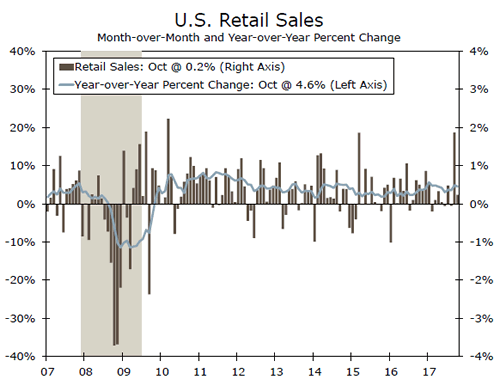
Retail sales rose 0.2 percent in October, down from an upwardly revised September print of 1.9 percent but besting expectations of a flat month. September’s gain was the highest monthly increase since March 2010 thanks to surges in fuel prices, building supplies and auto sales. Hurricane factors caused the boosts in these categories. Furniture stores likely also received storm boosts, up 0.7 on the month and up 4.4 percent over the year, as replacement purchases are made. Retail sales are now up a solid 4.6 percent over the year as the holiday season approaches.
In all, retail sales showed broad-based strength in October, consistent with continued consumer spending growth. Control group sales, stripping out the volatile food, auto and home improvement categories, increased stronger than the headline in the month, an encouraging sign for retailers and fourth quarter GDP.
Previous: 0.2% Wells Fargo: 0.2% Consensus: 0.3% (Month-over-Month)
Industrial Production • Friday
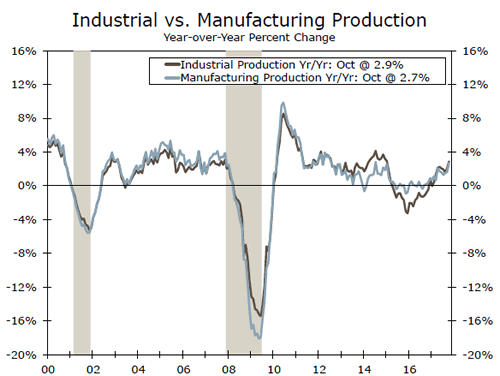
Industrial production (IP) increased by 0.9 percent in October, boosted by a 1.3 percent gain in manufacturing output, equaling the largest monthly increase since 2010. While a strong reading, the surge is exaggerated by factories coming back online after being knocked out of production from hurricanes. Specifically, chemicals, petroleum & coal and motor vehicle & parts output each saw significant increases. Although exaggerated, the general trend in IP is one of positive growth. Over the year, IP and manufacturing are up 2.9 and 2.7 percent, respectively. The ISM manufacturing index remains near cycle highs, business equipment investment looks to be encouraging and nearly three times as many manufacturing jobs have been added year to date compared to this time last year.
Global economic growth has helped drive up IP this year, and combined with the weaker dollar, we see steady growth in IP and manufacturing on the horizon.
Previous: 0.9% Wells Fargo: 0.2% Consensus: 0.3% (Month-over-Month)
Global Review
Economic Expansions in Europe Remain Intact
- Data released this week showed that the drivers of real GDP growth in the Eurozone in Q3 were broad based, which enhances the self-sustaining nature of the expansion. Despite some recent weakness in German industrial production, the expansion in the Eurozone appears to have remained intact in the fourth quarter.
- Growth in the British economy appears to have remained positive in the fourth quarter as well. However, as long as Brexit uncertainties linger, the outlook for the U.K. economy will remain clouded.
Economic Expansions in Europe Remain Intact
Data released this week confirmed that real GDP in the Eurozone rose 0.6 percent (2.4 percent at an annualized rate) on a sequential basis in Q3 (see graph on front page). The preliminary estimate of Q3 GDP growth was released a few weeks ago, but the data that were released this week provided a breakdown of the GDP data into its underlying demand-side components. Importantly, all the major components posted positive growth rates in Q3. Specifically, real consumer spending grew at an annualized rate of 1.3 percent, fixed investment spending rose 4.3 percent, real government consumption expenditures edged up 1.0 percent, and real exports climbed 4.7 percent. The broadbased nature of the spending increases enhances the selfsustaining nature of the economic expansion in the euro area.
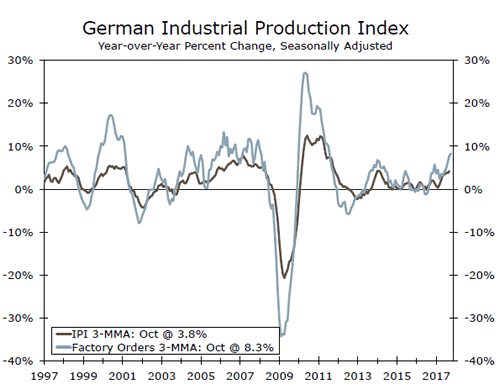
That said, the fourth quarter appears to have gotten off to a slow start. Industrial production (IP) in Germany plunged 1.4 percent on a monthly basis in October, which follows the 0.9 percent drop registered during the previous month. If German IP remains unchanged in November and December, then it will decline 1.2 percent (not annualized) in Q4 relative to Q3. Is the expansion in the Eurozone running out of steam?
In our view, it would be premature to panic about the economic outlook in the overall euro area. For starters, IP in France jumped 1.9 percent in October, which follows the 0.8 percent gain registered during the previous month. Moreover, German factory orders, which are highly correlated with German IP, rose 1.2 percent in September and another 0.5 percent in October. On a year-over-year basis, growth in German factory orders remains resilient (top graph). In other words, the pipeline in Germany remains full despite some temporary weakness in production recently. German IP should rebound in coming months.
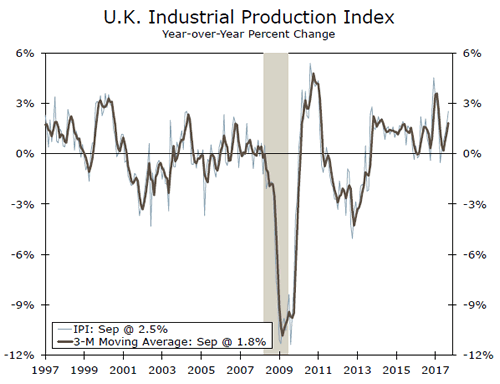
Across the English Channel, IP in the United Kingdom was flat in October on a sequential basis although the year-over-year growth rate remained solid (middle graph). However, the construction sector remained weak with output in that sector down 1.7 percent in October relative to the previous month. On a year-ago basis, construction output was down 0.2 percent in October.
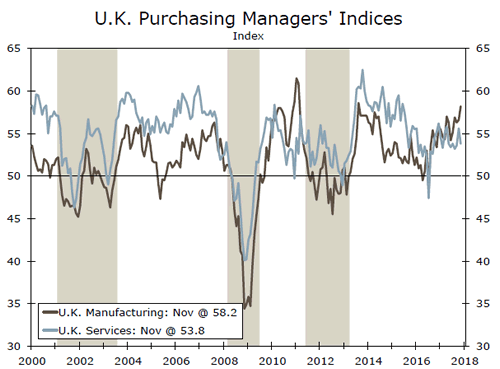
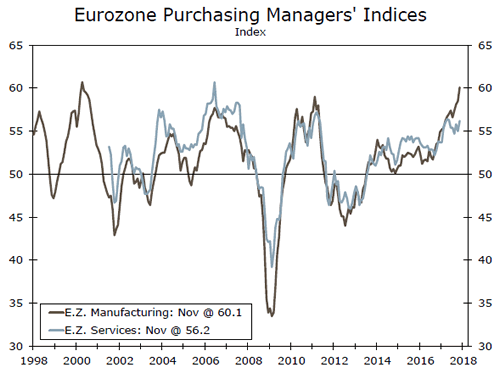
If the purchasing managers’ indices are any indication, then the U.K. economy has continued to expand in the fourth quarter, albeit at a modest pace. As shown in the bottom graph, the manufacturing PMI rose to a four-year high in November. However, the comparable index for the service sector, which accounts for the vast majority of value added in the British economy, fell back during the month although it remained above the demarcation line separating expansion from contraction.
As discussed on page 5, the Bank of England (BoE) holds a policy meeting next week, and it is virtually assured that it will keep policy unchanged. Although the UK and the EU this week appear to have agreed to the terms of their divorce, there is much uncertainty still surrounding the Brexit process. As long as that uncertainly lingers, the outlook for the U.K. economy will remain clouded and the BoE will remain cautious.
Global Outlook
China Industrial Production • Wednesday
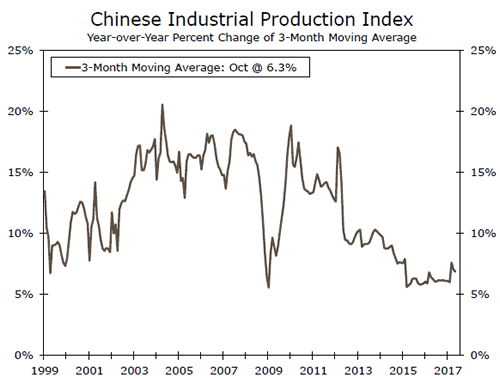
The week sees two important releases, one that looks at the production side in China: the industrial production index while the second, the retail sales index, look at what is happening to domestic consumption in the country. Both releases are for the month of November. The Chinese industrial production index has been relatively stable on a year-over-year basis as well as on a year-todate basis. However, markets are expecting a slight slowdown from the average over the past three months, consistent with what we have seen from analysts with regards to economic growth in the second-largest economy of the world.
Meanwhile, the retail sales index has shown some weakening lately while consensus is expecting some slight rebound. If that is not the case and we see some more weakness in this index, it will be the first time since February 2004 that growth in this index has dropped below 10 percent on a year-earlier basis.
Previous: 6.2% Consensus: 6.2% (Year-over-Year)
Eurozone Manufacturing PMI • Thursday
On Thursday, markets will have a chance to look at an advance reading of how the Eurozone manufacturing sector ended the year with the release of the preliminary December manufacturing PMI. We will also get the release of Germany’s preliminary manufacturing PMI. Both manufacturing PMIs surprised the markets in November by hitting high levels for the series, at 60.1 for the Eurozone and at 62.5 for Germany, so an improvement from such strong performances is probably not expected (see the Global Review section for more insights on this topic). However, if these preliminary readings for the Eurozone are able to beat the November numbers, then this will be a good signal for the continuity of growth in the Eurozone as well as in the global economy in general.
Meanwhile, on Tuesday markets will also get the ZEW expectations index for both the Eurozone as well as for Germany.
Previous: 60.1 Consensus: 59.7
Bank of England Interest Rate • Thursday
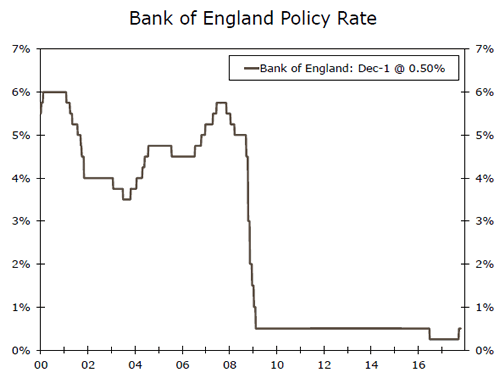
On Thursday, markets are expecting the Bank of England to stay put in terms of monetary policy by not changing the policy rate, which today stands at 0.50 percent. The decision will end a week full of data releases for the United Kingdom, with consumer price inflation scheduled to be released on Tuesday. Several employment measures are going to be released on Wednesday, including the claimant count rate and the jobless claims change for November along with the ILO unemployment rate and several data points on average and weekly earnings for October.
Also on Thursday, we will also get the release of retail sales for the month of November, a series that has been weakening considerably lately and that could point to further weakness in consumer demand in the United Kingdom.
Previous: 0.50% Wells Fargo: 0.50% Consensus: 0.50%
Point of View
Interest Rate Watch
Turning a Blind Corner
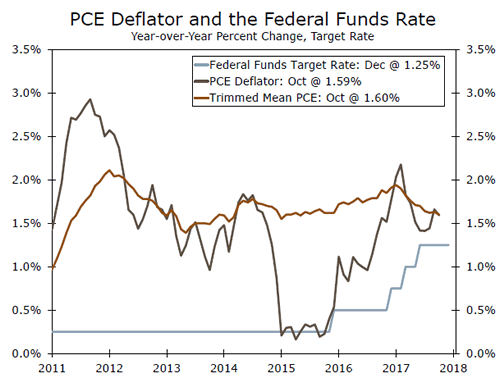
Economic fundamentals and policy intentions are turning a corner as we turn to a new year. Our view is that the economic fundamentals signal a pick up in the pace of inflation, as measured by the PCE deflator, while monetary policy intentions are for further fed funds rate increases in 2018. The upward turn in both series alters the pattern of flat and low for the past three years. We are turning the blind corner in the fundamentals.
Inflation Upswing
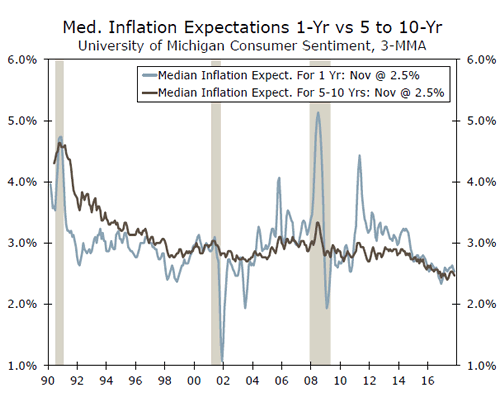
With the PCE deflator at 1.4 percent on average over the past three years, which is significantly below the FOMC’s benchmark 2.0 percent target, our expectations are for a rise in the PCE deflator to 2.0 percent in 2018. In contrast, the median inflation expectations from the University of Michigan survey (top graph) has drifted lower since 2014 and settled in around 2.5 percent for next year. An upward turn in the measured pace of the deflator would support the case for further FOMC rate increases.
Smaller Margin for Error
One concern we have expressed in recent months has been the narrowing of the margin between the Fed funds rate and the PCE measure of inflation (middle graph). Looking into 2018, the implied future of the FOMC’s intended funds rate path would produce a positive real funds rate that we have not seen for the past two years. How would this positive real rate impact credit demand and supply, would be an interesting question given our lack of experience in recent years, and the recent extent of market financing.
A Turn in NFC Interest Expense?
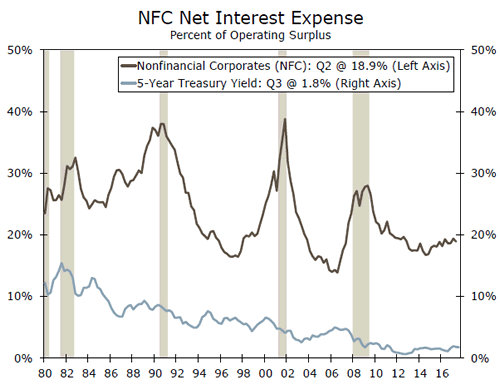
In recent years, the pace of corporate bond issuance has been very strong. As illustrated in the bottom graph, net interest expense as a percent of operating surplus has been very low compared to the past but the series is rising just modestly over the past two years. With the rise in interest rates projected by the FOMC we should see a sharper upward turn in these interest rate expenses and perhaps a stretch for credit quality.
Credit Market Insights
How Will Consumers Pay for Their Holiday Purchases?
Over the 2017 holiday season, consumers are planning to spend $967.13 on average, according to the National Retail Federation. This year, more of these transactions are likely to be made using debit and credit cards, which has implications for credit card balances and how much consumers spend.
Cash remains a dominant payment method. In 2016, 31 percent of U.S. transactions were conducted in cash, compared to 27 percent using debit cards and 18 percent using credit cards, according to the Diary of Consumer Payment Choice. However, cash made up only 8 percent of the value of transactions, since it is typically used for small sums (average of $22, versus $57 for credit cards).
While cash is not close to its deathbed, cash use is declining as a share of transactions. As recently as 2012, cash made up 40 percent of transactions, but is now being replaced by credit, debit and electronic bill pay. One factor behind this trend is the rise of e-commerce, since cash transactions almost always occur in person. In the third quarter, retail e-commerce sales reached $115.3 billion, up 15.5 percent on the year. A continued shift to online shopping may therefore contribute to increased demand for credit cards and, potentially, rising credit utilization.
Higher credit and debit card use may also boost spending. Customers can be willing to pay up to twice as much when using credit cards rather than cash, because of higher liquidity but also because "plastic" divorces the joy of shopping from the pain of paying.
Topic of the Week
Don’t Count Out Millennial Homeownership
Millennials came of age during one of the most tumultuous economic periods in generations. A poor labor market and a vastly different housing landscape following the financial crisis has sparked many to wonder whether Millennials’ relationship with housing would ever resemble that of the generations that came before.
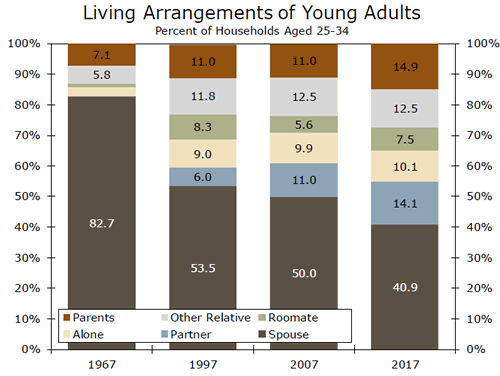
In 2016, the share of 25-34 olds living with their parents rose to a record high 15.0 percent. The increase over the past decade marked an acceleration from a longer-term trend of fewer young adults living independently (top graph). Economic factors and shifting preferences are to blame. In addition to starting their career in what was until rather recently a sluggish job market, a hallmark of the Millennial generation has been hefty student debt loads. Housing costs that have outpaced wage growth during this expansion have made also it more difficult for Millennials to afford to live on their own.
Changing family forms are partly responsible for "failure to launch" as well. Over the last half-century, the age of first marriage increased by more than six years. As fewer young adults live with spouses/partners, staying with relatives or roommates offers an alternative means to reduce living costs by sharing expenses.
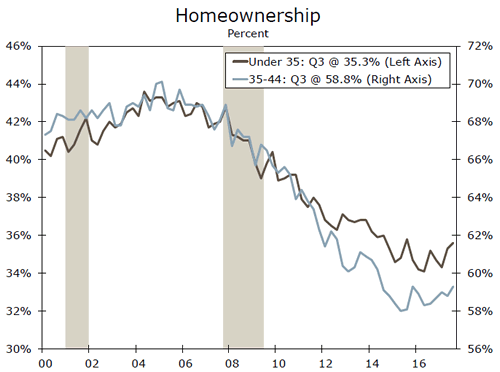
There are some recent signs of improvement, however, in Millennials moving out and becoming homeowners. In 2017, the share of young adults aged 25-34 living with parents declined for the first time since 2011. Ownership among households under age 35 has risen 1.5 percentage points since the cycle low set in mid-2016, which is more than any other age group (bottom graph).
While the timeline may be pushed back, the vast majority of Millennials still report a desire to buy a home one day. As Millennials age into higher-paid, more secure jobs and settle down with partners, they are gaining the financial resources to support independent households more easily. We believe that is too early to write them off as a generation of renters. See our recent report "Are Millennials Moving Out and Settling Down?" for more detail.
