
. Episodes vary in severity, but each posed unique challenges to monetary policymakers. In this second installment, we briefly review historical instances of stagflation and their accompanying monetary policy decisions. The distinctive experiences point to an economy whose structural drivers of growth have shifted over time, which underscores the idea that a policy enacted back in the 1970s may not have the same effect today as it did then.)
Part II: A Brief Review of Past Episodes of Stagflation
Summary
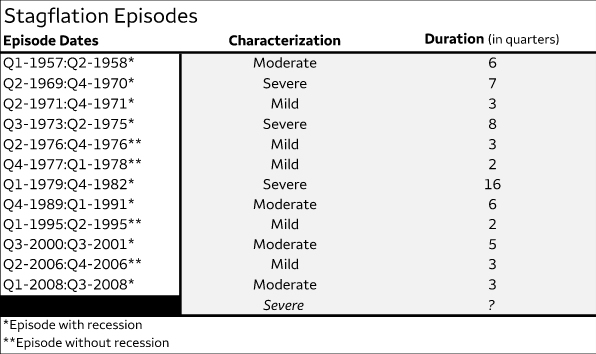
- In the first installment of this series, we presented a simple framework to characterize stagflation and identified 13 instances in the United States since 1950.
- Episodes vary in severity, but each posed unique challenges to monetary policymakers. In this second report, we briefly review historical instances of stagflation and their accompanying monetary policy decisions.
- Six of the 13 episodes of stagflation occurred in the 1970s as oil price shocks, imbalanced fiscal and monetary policy and robust labor cost growth placed upward pressure on prices and weighed on output growth.
- The episodes outside the 1970s have ranged from mild to moderate, with the exception of the post-COVID pandemic occurrence, a topic that we will turn to in the final installment of this three-report series.
- Over time, historical instances of stagflation have often been met with accommodative monetary policy to support employment, despite elevated price growth.
- The degree to which the accommodative policy stance exacerbated stagflation depends on the drivers of the inflationary bouts themselves and whether the economy’s structure would help entrench or dilute price momentum.
- External factors, such as oil price shocks, were associated with severe episodes of stagflation, but expansionary fiscal policy enacted amid a tight labor market also played a role. Those dynamics mirror the current environment, as the unemployment rate is at a decades’ low and the fiscal deficit is swelling. Will the economy suffer from stagflation in the near term?
All Stagflation Is Not Created Equal
We presented a simple framework to characterize stagflation in the first installment of this series. Using that framework, we identified 13 instances of stagflation in the United States since 1950 (Figure 1). Episodes vary in severity, but each posed unique challenges to monetary policymakers. In this second installment, we briefly review historical instances of stagflation and their accompanying monetary policy decisions. The distinctive experiences point to an economy whose structural drivers of growth have shifted over time, which underscores the idea that a policy enacted back in the 1970s may not have the same effect today as it did then.
Figure 1
Mild Cases
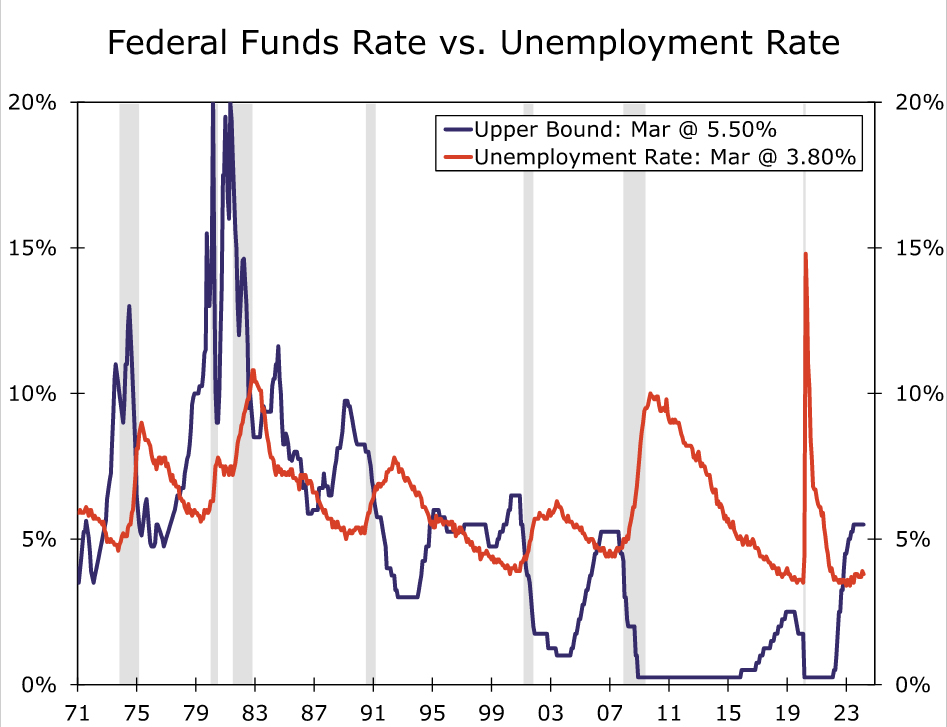
The first mild episode of stagflation occurred in 1971. The U.S. economy had just emerged from a recession that ended in the final quarter of 1970. Real GDP growth was sluggish, unemployment was elevated at around 6% and inflation was persistent. The Chair of the Federal Reserve at the time, Arthur Burns, was keen on supporting the labor market and moved forward with expansionary policy in late 1971 by lowering the target range of the fed funds rate by 200 bps (Figure 2). Around the same time, President Nixon ordered that the gold standard be abandoned, un-anchoring the U.S. dollar, and authorized a 90-day freeze on wages and prices to dampen inflation. The bold fiscal approach squashed inflation shortly after its implementation, and output growth quickly picked back up in 1972, which together effectively ended this mild case of stagflation. The reprieve was short-lived, however, as the following instance of stagflation in 1973-1975 saw the year-over-year change in the CPI rise to its highest since 1947.
The next two mild episodes occurred in 1976 and 1977-1978, both in the absence of a recession. In the lead up to these episodes, a 1973 oil embargo placed on the United States by a coalition of Middle Eastern countries sent domestic oil prices skyrocketing, as the U.S. was heavily reliant on petroleum imports at that time. While the embargo was lifted in 1974, a series of global oil production cutbacks led to a dramatic rise in energy prices throughout the 1970s, which passed through to higher wages via price indexation clauses in many union workers’ wage contracts.1 The bid up in oil and labor costs squeezed business profit margins and led to a trend rise in the unemployment rate throughout the decade, while the CPI also ripped higher on a year-over-year basis. Yet the paths of CPI inflation and the unemployment rate, while on upward trajectories, were incredibly variable, which obscured the view for monetary policymakers. The target range of the fed funds rate was mostly steady in 1976-1977 before drifting higher in 1978. Elevated and volatile inflation led to choppy real GDP growth, and that dynamic resulted in the break up of these two mild cases of stagflation.
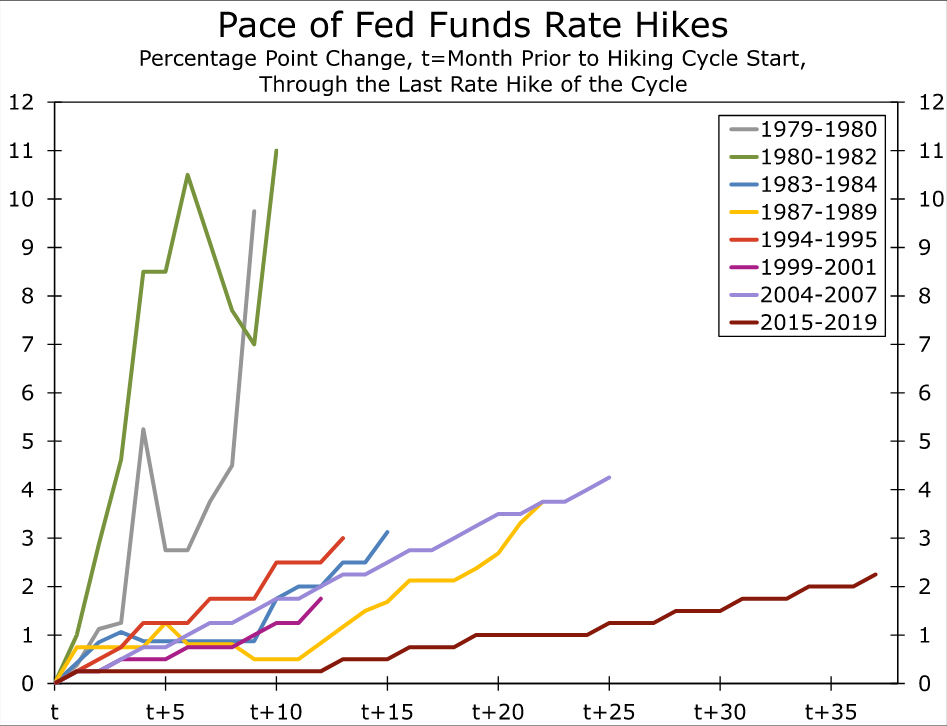
The final two mild episodes took place in 1995 and 2006 when inflation was relatively tame. In the first half of 1995, CPI inflation was above the 2% benchmark, and real GDP growth was roughly three percentage points below its prior cycle’s average of 4.4%. An aggressive monetary policy tightening cycle the year prior likely contributed to the slowdown in output growth—the FOMC had just wrapped up its 1994 tightening cycle, where it lifted the upper bound target by 300 bps in just 12 months (Figure 3). While price growth was strong, accelerating labor productivity amid the broad adoption of computers in the business sector eventually put downward pressure on inflation and supported economic output in the back half of the 1990s. In view of the pickup in the economy’s potential output, the FOMC lowered the target range by just 75 bps in late 1995 and early 1996 to stimulate near-term activity before holding policy mostly steady at an upper bound of 5.25-5.50% through Q2-1998.
In 2006, real GDP growth slowed to a crawl for two straight quarters and the CPI edged up to 3-4%. Residential construction and consumer spending were losing momentum, while the dollar was depreciating. Similar to the 1995 episode, the FOMC had been gradually tightening policy at a 25-bps pace from 1.00% in mid-2004 to 5.25% by mid-2006. The updraft in borrowing costs weighed on output growth, while the weaker dollar and rising commodity prices placed upward pressure on inflation. Yet contained inflation expectations and tamped-down aggregate demand helped CPI inflation ease below the 2% target by Q3-2006, which ended this mild case of stagflation while the FOMC remained on hold at an upper bound of 5.00%.
Moderate Cases
In the first instance of moderate stagflation, CPI inflation picked up to above 3% in 1957 after averaging just 0.6% the prior two years. William McChesney Martin, the Chair of the Federal Reserve, responded with tight policy that led to a sharp recession that year. (The Fed primarily conducted monetary policy via changing bank reserve ratio requirements at the time). The credit crunch, as well as a marked decline in U.S. exports amid a global recession that coincided with the 1957 influenza pandemic, led to a sharp 4% contraction in real GDP from Q3-1957 to Q1-1958. The activity slowdown helped to significantly cool inflation, however, and the CPI returned to its prior cycle’s average of 0.9% by Q1-1959.
The second moderate stagflation episode occurred from 1989 to 1991. Inflation was gaining momentum as the new decade rolled around, and the FOMC was incrementally increasing the fed funds rate from 1988 through early 1989. However, economic activity started to wobble in 1989, causing the FOMC to pivot to an accommodative stance by mid-1989. Then, an energy shock during the Gulf War led to higher food and gas prices in late 1990, causing the CPI to peak at 6.2% year-over-year in Q4-1990. The mixture of the energy price shock and accommodative monetary policy led to a gradual pace of disinflation that kept the CPI above the 2% target through 1991 and real GDP growth that averaged roughly four percentage points below the prior cycle’s average.
The final two episodes of moderate stagflation took place in 2000-2001 and 2008. In the early 2000s, tight natural gas supplies and elevated medical care costs were notable drivers of elevated inflation. The FOMC was on hold at an upper bound target of 6.50% through most of 2000, but it cut rates as the calendar turned to 2001 amid a rise in the unemployment rate and the collapse of several technology companies. Real GDP growth was only mildly negative over the episode but remained below its prior cycle’s average of 3.8%. In 2008, skyrocketing gasoline and other commodity prices drove the pickup in the CPI. The FOMC started to cut rates in the second half of 2008 in response to mounting signs of significant financial market stress, a rising unemployment rate and declining consumer spending. Real GDP growth was choppy during this episode as the economic shocks of the financial crisis developed gradually. In short, the recessions during the 2001 and 2008 episodes of stagflation, while vastly different in depth, helped dampen inflation quickly. The CPI fell below 2% year-over-year before each recession ended.
Severe Cases
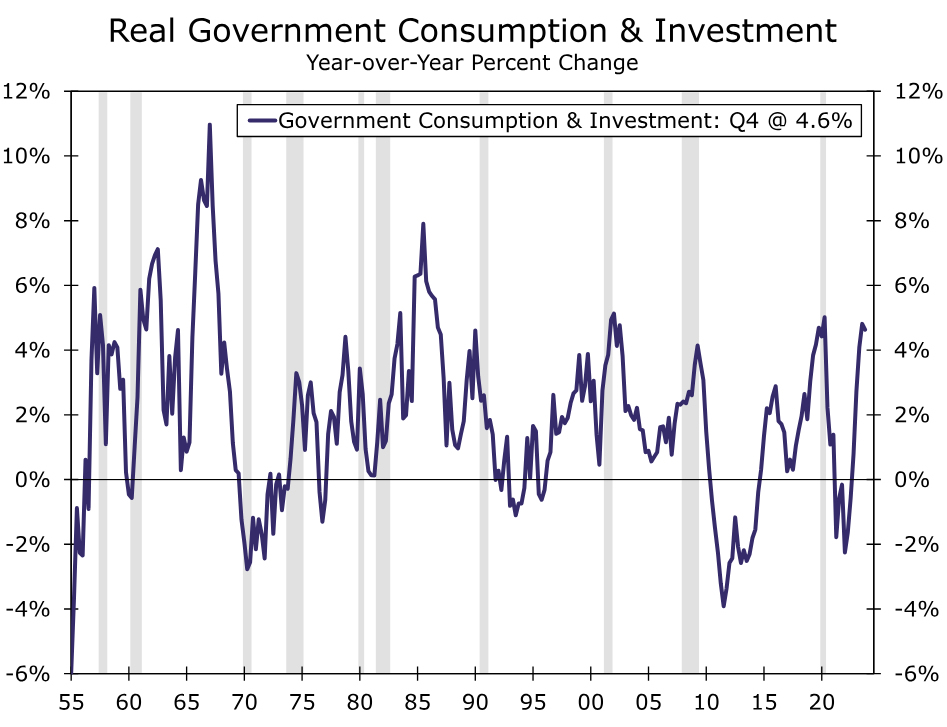
The first severe episode of stagflation took place 1969-1970, coinciding with a recession. In the run-up to this episode, President Lyndon B. Johnson’s Great Society programs had injected significant amounts of fiscal stimulus in the economy, while military investment was also ramping up amid the Vietnam War (Figure 4). The ballooning in fiscal spending coincided with a tight labor market; the unemployment rate was running below 4% in the late 1960s. At this time, the Federal Reserve was also following an “even-keel” policy where it would hold interest rates steady between the announcement of a Treasury issuance and the eventual bond sale.2
As government spending ramped up, Treasury issuances occurred frequently and curtailed the Fed’s ability to conduct monetary policy effectively. Ultimately, expansionary fiscal policy, combined with an economy near full employment, appeared to be the primary culprits of the 1969-1970 episode’s high inflation. On a year-ago basis, the CPI was more than three standard deviations above the prior cycle’s average of 1.4% for seven consecutive quarters, while real GDP growth trended well below the prior cycle’s average of 6.7%.
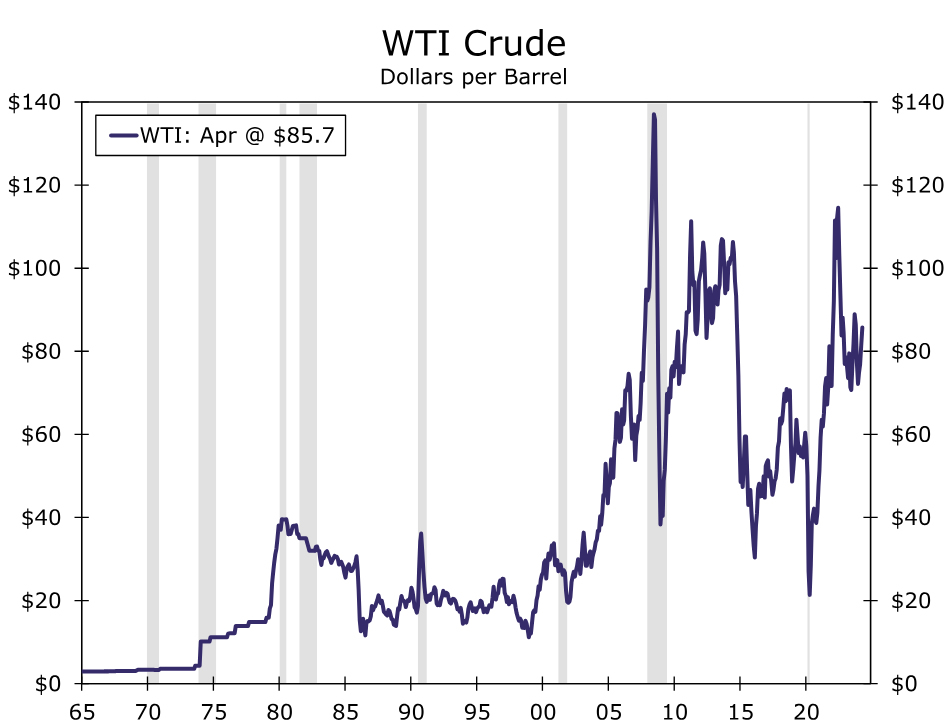
The next two episodes of severe stagflation occurred in 1973-1975 (7 quarters) and 1979-1982 (16 quarters). Two major oil price surges (Figure 5)—the first associated with the aforementioned oil embargo on the United States in 1973 and the second associated with the Iranian Revolution in 1978-1979—sent shock waves through the economy, leading to elevated CPI inflation of the cost-push variety. At the time, the consensus among economists was that monetary policy tools were not effective at remedying inflationary shocks caused by exogenous events, but that they were still instrumental to maximizing employment. Thus the FOMC primarily enacted accommodative policy during these episodes to support the employment side of the economy, which was struggling underneath the weight of sluggish output growth amid quickly rising and variable business input costs.
With the Federal Reserve generally on an accommodative stance, the federal government instituted policies aimed at halting robust price growth. As mentioned in the Mild Cases section, President Nixon ended the dollar’s convertibility to gold, which contributed to the eventual end of the Bretton Woods System, and enacted price and wage controls to slow inflation in 1971.3 The Ford Administration introduced the Whip Inflation Now (WIN) program in 1974, which encouraged consumers to voluntarily cut back on spending.4 Both programs were largely unsuccessful at stamping out inflation’s underlying strength, especially as the Federal Reserve was maintaining a counteracting accommodative stance at the same time. Momentum in input prices pushed the CPI higher through the back half of the 1970s and the year-over-year rate peaked at around 14.5% in 1980. The 1973-1975 and 1979-1982 stagflation episodes are broken up into two separate instances because inflation slowed in the middle of the decade closer to 5%-6% while real GDP growth treaded water at around a 2% average.
The final episode of stagflation occurred in the wake of the COVID pandemic, which is a topic that we will turn to in the final installment of this series. For now, we can see that historical instances of stagflation have often been met with accommodative monetary policy to support employment, despite elevated price growth. The degree to which the Federal Reserve’s accommodative stance exacerbated stagflation depends on the drivers of the inflationary bouts themselves and whether the economy’s structure would entrench (e.g., the 1970s) or dilute (e.g., 2000-2001) price momentum. External factors, such as oil prices shocks, were associated with severe episodes of stagflation, but expansionary fiscal policy enacted amid a tight labor market also played a role. Those dynamics mirror the current environment, as the unemployment rate is at a decades’ low and the fiscal deficit is swelling. Will the economy suffer from stagflation in the near term?5
Endnotes
1 – Around 60% of workers under collective bargaining agreements had cost of living clauses in their contracts in the 1970s. Consequently, the oil price’s shock to inflation led to an automatic acceleration in wages, which pushed input costs up further.
2 – See a 1967 memo to the Federal Open Market Committee on the Committee’s interpretation of the “Even Keel” Policy.
3 – See a short explainer from the International Monetary Fund on the end of the Bretton Woods System.
4 – See a short article from the Federal Reserve Bank of New York’s research library for more information on the Whip Inflation Now campaign.
5 – This series is based on a 2024 American Economic Association Annual Meeting paper by Azhar Iqbal and Nicole Cervi titled “Characterizing Stagflation into Mild, Moderate and Severe Episodes: A New Approach”. Please contact the authors if interested in the full paper.