U.S. Highlights
- It was a good start to the week for U.S. equities, with stock prices boosted by another round of strong earnings reports and a weakening in the US dollar to its lowest level in over a year. However, these gains were offset by dips in health care and tech stocks by Friday afternoon.
- As expected, the FOMC voted unanimously to leave its benchmark rate unchanged, while signalling that the balance sheet normalization process will likely begin in October.
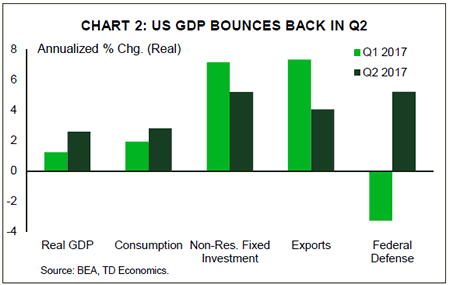
- The American economy accelerated in Q2, returning to a slack-absorbing pace of 2.6% growth, led by strength in consumption and private fixed investment.
Canadian Highlights
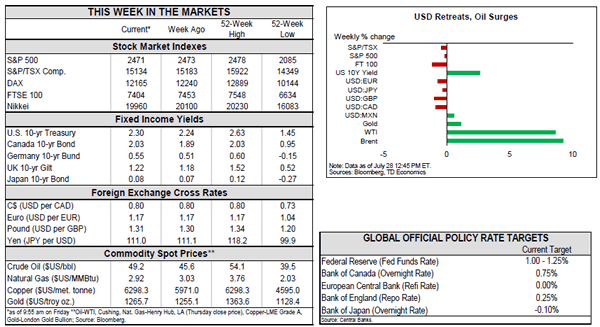
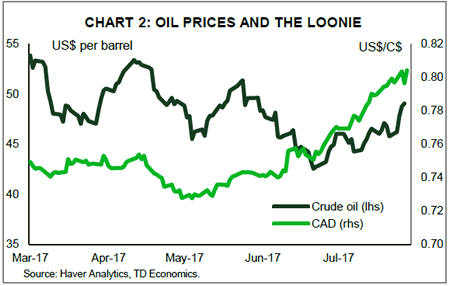
- The Canadian dollar hit a 2-year high of 80 US cents this week, marking a 10% gain since May. Gains were driven by robust economic data, expectations for further Bank of Canada rate hikes and rising oil prices.
- The Canadian economy expanded by 0.6% in May, with growth fairly broad-based across industries. This puts tracking for the second quarter at 3.8%.
- The WTI oil benchmark rose 7.5% from last week’s close, to over US$49 per barrel, driven by another decline in US inventory levels and a pledge from Saudi Arabia to reduce exports.
U.S. – Growth Accelerates in Q2
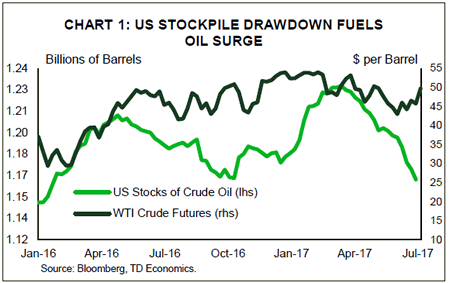
It was a good start to the week for U.S. equities, with stock prices boosted by another round of strong earnings reports. Consumer discretionary and staples led the sectors in performance, a reflection of the increasingly important role that consumer spending is having in lifting growth. Energy stocks also posted large gains, helped by a rebound in the price of oil amid Saudi Arabia’s commitment to restrict oil exports in August and another bullish U.S. inventory report (Chart 1). By the end of the week, the weighty tech and health care sectors offset these gains. A weakening in the USD provided support for equities, notably early in the week, while European indices were weighed down by an appreciation in the sterling and the euro vis-à-vis the greenback – which fell to its lowest level in over a year.
The dollar did not get much support from the FOMC. As expected, the Committee voted unanimously to leave its benchmark rate unchanged, but the policy statement highlighted a dovish turn, with the Committee appearing more concerned about the tepid inflation data. This led markets to push out Fed hike expectations. Despite this, the Committee expressed their intention to begin the process of balance sheet normalization "relatively soon". This is likely to be announced at the FOMC meeting in September, with run-off to begin in October. However, another rate hike is unlikely until at least the end of the year. We expect that a December hike may yet happen, but such an outcome depends on inflation firming in the coming months. Many of the disinflationary pressures appear to be transitory in nature, with cell phone discounts, lower commodity prices, and falling prices of imported goods related to past US dollar strength. But these pressures should ease in the second half of the year, while the USD upside potential remains limited for three reasons. For one, the Fed’s rate hike trajectory looks to be more gradual than previously communicated. Secondly, the balance sheet normalization will have a smaller currency impact than an equivalent rate increase, and lastly, strengthening global economies should allow central banks such as the ECB and BoE to pare back supportive monetary policy measures. Second quarter data supports this view, with both French and Spanish economies having expanded at a healthy pace in Q2.
The American economy also accelerated in the second quarter, largely as expected, returning to a slack-absorbing pace of growth (Chart 2). Led by strength in consumption and private fixed investment, the second quarter saw the economy expand by 2.6%. The consumer’s role in Q2 growth was highlighted by strength in spending on goods after a weak showing at the start of the year. And with job and income growth remaining strong, there is room for further advancement on this front over the remainder of the year.
Remaining top-tier domestic data releases this week telegraphed a mixed picture of the housing market. Existing home sales pulled back to a still healthy 5.52 million (annualized) as lack of inventory and eroding affordability prevented purchases. At the same time, new home sales ticked up 9.1% from a year ago, suggesting that demand remains intact. We look forward to next week’s bevy of reports that should clarify how the economy has done in the first month of the third quarter, with the employment, income & spending, and ISM survey reports being top of mind, as we seek confirmation that economic momentum remains robust during the third quarter.
Canada – The Loonie Continues To Soar
It was a quiet week in terms of Canadian economic data, with this morning’s GDP report the only key release. But that didn’t stop the Canadian dollar from soaring to a two-year high of over 80 US cents. The loonie has generally been on the rise over the last couple of months, up 10% from a low of just under 73 US cents in May. The recent appreciation has been driven by a few key factors, including strong economic growth, some convergence in the direction of monetary policy – and thus a narrowing in bond yield spreads – with the U.S., and higher oil prices.
The Canadian economy has been outperforming since mid-2016, and it looks like growth in the second quarter of this year will continue the trend. Following a 0.2% advance in April, the Canadian economy expanded by an eye-popping 0.6% in May, with the growth fairly broad based across industries. This puts the second quarter on track for robust growth of 3.8%. The steady string of strong economic data, particularly relative to other G7 countries including the U.S., has certainly been supportive for the Canadian dollar.
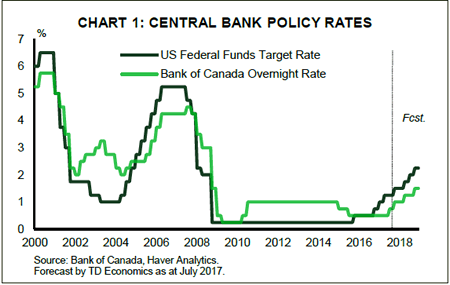
It has also helped underpin the about-face by the Bank of Canada with respect to its stance on monetary policy, with a six-week period of hawkish rhetoric leading the central bank to hike rates for the first time in seven years in July. Indeed, the Bank indicated that despite a soft inflation backdrop, the economy is on a stronger footing and the emergency level of interest rates that were needed during the oil price collapse are no longer warranted. This follows the lead of the Federal Reserve that began a slow rate hiking cycle at the tail end of 2015. This change in direction of monetary policy – putting it more in line with that in the U.S. – has helped drive the loonie higher.
Meanwhile, crude oil prices have also picked up, reaching a two-month high of US$49 per barrel this week. This marked a 7.5% increase over last Friday’s close. Gains were largely prompted by a third consecutive decline in weekly U.S. inventories and a pledge from Saudi Arabia to reduce exports, particularly to the U.S. where stock levels are heavily scrutinized. Indeed, the Saudi rhetoric was the only constructive development that came out of the meeting of the OPEC-Non-OPEC group at the start of the week, as the deal was essentially left unchanged. The group did however indicate that Nigeria and Libya – which are currently exempt from output restrictions and have been ramping up production in recent months – could become part of the deal once they reach a specific level of production on a sustainable basis.
Given the relatively quick ascent of the loonie in recent weeks, the upside is likely limited going forward. While we expect oil prices to gradually creep higher, they will remain vulnerable to any bearish indicators, with the risks largely tilted to the downside. Meanwhile, the economy is unlikely to maintain the stellar pace of growth seen in recent quarters. Still, it should remain healthy, allowing the Bank of Canada to hike rates again in the fall of this year and twice more in 2018. With much of these expectations already priced in, we expect the Canadian dollar to hold at around 79 US cents through 2018.
U.S.: Upcoming Key Economic Releases
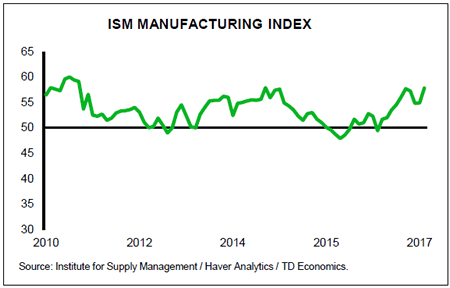
U.S. ISM Manufacturing Index – July
Release Date: August 1, 2017
Previous Result: 57.8
TD Forecast: 56.9
Consensus: 56.2
TD looks for ISM Manufacturing to post a modest pullback to 56.9 from 57.8. The dip partly reflects a correction from the June pickup and would be in line with the slips registered in both ISM-adjusted Empire and Philly Fed indexes. Hard data such as manufacturing production is supportive of only a partial reversal.
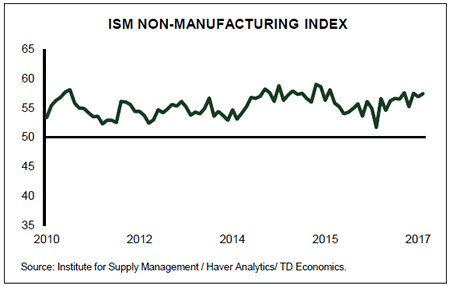
U.S. ISM Non-Manufacturing Index – July
Release Date: August 3, 2017
Previous Result: 57.4
TD Forecast: 57.0
Consensus: 56.8
The ISM non-manufacturing index released later in the week should show a similar story of sustained strength as its manufacturing counterpart, albeit at a slightly softer pace (57.0 vs 57.4). Both releases would be supportive of above-trend GDP growth in the third quarter.
U.S. Employment – June
Release Date: August 4, 2017
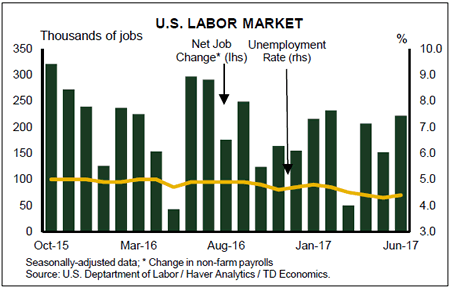
Previous Result: 222k, unemployment rate 4.4%
TD Forecast: 190k, unemployment rate 4.3%
Consensus: 180k, unemployment rate 4.3%
We expect July nonfarm payroll employment to moderate to a 190k pace after registering a better than expected 222kk gain in June. Labor market indicators on balance point to another gain in the vicinity of 200k. However, we see risk for a sharp pullback in government jobs from their outsized 35k gain in June, thereby dampening headline growth.
We expect the unemployment rate to slip back to 4.3% on the back of robust employment growth. On wages, calendar effects point to a 0.3% m/m increase in average hourly earnings, but base effects may leave a year-on-year pace lower at 2.4% vs 2.5%. A pickup in wage growth will help strengthen the Fed’s, and the markets’, conviction on raising rates this year, and thus we expect this indicator to drive the market response.
U.S. Personal Income & Spending – June
Release Date: August 1, 2017
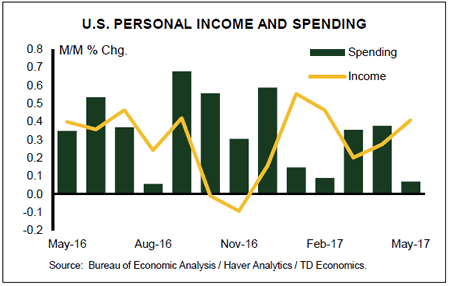
Previous Result: Income 0.4% m/m, spending 0.1% m/m
TD Forecast: Income 0.4% m/m, spending 0.1% m/m
Consensus: Income 0.4% m/m, spending 0.1% m/m
Headline PCE inflation is expected to advance 1.4% in June, which we believe is consistent with a 1.6% pace for Q2 as a whole as reported in the advance GDP release. That would reflect unchanged prices on the month, including a drag from energy prices. We look for the June core PCE index to rise 0.1% m/m, consistent with the core CPI release. On a year-ago basis, the advance Q2 GDP release suggests that core PCE inflation likely rose 1.5% y/y in June, which is slightly above pre-GDP consensus expectations for a 1.4% y/y increase. The June report itself should show continued weakness in "transitory" factors, including cellphone services, with risk for further softness in healthcare services prices.
Nominal PCE (personal spending) is expected to post a relatively soft 0.1% rise in June, though past revisions point to risk for a slightly stronger gain. The quarterly gain is already reported and came in at a solid 2.8%, but the June figure is important for gauging the handoff to Q3. We also expect a solid 0.4% increase in June personal income, though past revisions also suggest scope for surprise.
Canada: Upcoming Key Economic Releases
Canadian International Trade – June
Release Date: August 4, 2017
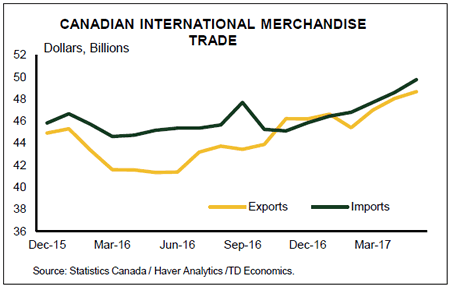
Previous Result: -$1.10b
TD Forecast: -$1.40b
Consensus: -$0.90b
The international trade deficit is forecast to widen further to $1.4bn in June. The appreciation of the Canadian dollar following the Bank of Canada’s hawkish pivot should lead to softer exports and imports while another decline in energy prices will weigh on the nominal print. Crude oil prices fell by roughly 6% in June but we think there is scope for export volumes to increase after a surge in production during May. Meanwhile, non-energy exports should see a more modest decline due primarily to a drag from weaker motor vehicle shipments. On the other side of the ledger, imports should see a modest decline to offset the pullback in export activity. Aircraft imports, which contributed over half of the 2.4% gain last month, could see a minor pullback but should retain most of their strength on deliveries to Air Canada.
Canadian Employment – July
Release Date: August 4, 2017
Previous Result: 45k, unemployment rate: 6.5%
TD Forecast: 0k, unemployment rate: 6.5%
Consensus: 19k, unemployment rate: 6.5%
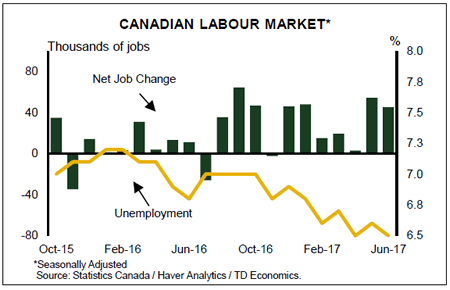
Employment growth is forecast to pause in July following two months of robust gains. Small business sentiment and hiring intentions have cooled since peaking in May and survey data has pointed towards more subdued hiring conditions in manufacturing. The details of the report will likely show a relative outperformance in goods-sector hiring owing primarily to a pullback in professional services, which is coming off its strongest two-month gain on record with 53k added jobs in May and June. We also expect a continuation of last month’s rotation towards part time employment. Seasonal patterns tend to support part time hiring in July and part time employment remains well below its peak level from January, despite full time payrolls adding 175k employees since.
The unemployment rate should hold steady at 6.5% so long as labour force growth does not exceed 20k, which is unlikely following the 0.3pp increase in the participation rate over the last two months. Wage growth could see a pickup on the lagged impact of reduced slack but any improvement should be marginal.
