Key Points:
- A reversal is looking likely from a technical perspective.
- The bullish trend could extend moving ahead but resistance is in place at 1.3554
- Downside risks mitigated by the 100 day EMA and the medium-term trend line.
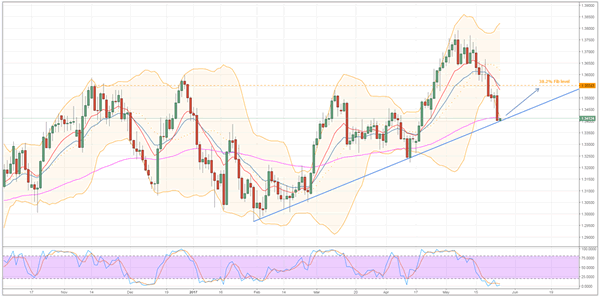
The Loonie has been under fire recently but things could be about to improve for the embattled pair in the session to come. Specifically, a number of technical signals are now shifting their bias which suggests a reversal is now on the way. What’s more, now that the BoC’s interest rate decision is done and dusted, there is little in the way of a rally from a fundamental perspective which should see the technical bias leant on somewhat more heavily moving forward.
Two of the clearest indications that selling pressure may have finally reached an impasse come from the 100 day EMA and the medium-term trend line. Looking first at the moving average, it’s fairly plain that dynamic support provided by the 100 day measure is exerting some degree influence on the pair – effectively stalling the prior session’s rather voracious plunge lower. As for the trend line, the fact that the pair has respected the line could be a signal that the uptrend is not done just yet and this latest tumble is merely a correction in a longer-term trend.

However, even if this is not the case and we are instead nearing the end of the recent uptrend, we can expect to see at least a little bit of bullishness moving forward. Aside from the factors mentioned above encouraging buying pressure, the movement of stochastics into oversold territory will also be spurring the bulls on. Furthermore, the Loonie is testing the lower boundary of its highly divergent Bollinger bands – a sign that we can expect to see it trend back to the basis line shortly.
In the event that the reversal highlighted above does occur, gains are likely to run into resistance at around the 1.3554 handle. The combination of not only a historical zone of resistance but also the 38.2% Fibonacci level and the basis line of the Bollinger bands around this price should prove more than a match for the bulls who are already on shaky ground. However, there is a slim chance that the overarching bullish trend does continue and trace out a three drive or something similar. This being said, we will need to see the Loonie above the 1.37 handle before we can begin to speculate on such a pattern taking shape.
Ultimately, keep an eye on the pair as, whatever happens, it’s likely to be interesting. In particular, monitor the Loonie as it approaches the 1.3554 mark as, if it breaks above this level, it could signal that further gains are on the way. Nevertheless, given that the effects of the ‘Trump Bump’ have largely dissipated, it pays to be somewhat pessimistic regarding ongoing USD strength and err on the side of caution
